Speculation
Since the outbreak of the economic crisis in 2008, where the property bubble burst, jobs in Spain were
destroyed as quickly as they had been created. As construction is a labor intensive sector, its collapse
reverberated through other areas of the economy. Between 2002 and 2007, the total number of job
holders, many of them on temporary contracts, rose by a massive 4.1 million, a much steeper rise than
in any other EU country and more than three times higher than the number created in the preceding
16 years. Since 2008, more than 3 million jobs have been lost, around half of them in the construction
and related sectors.
Spain’s current unemployment rate has decreased over the last 6 months but is still very high at over
23% of the population. In Barcelona, the number of unemployed in November stood at 428,634 people,
1.35% less than October, representing 5,871 fewer jobless. Although there has been a positive increase
in the amount of jobs there are still many people, especially the youth, that are unemployed.
The increase in employment is not necessarily going to continue and a new vision or solution needs to
be addressed in order to create new opportunities for people to get jobs.
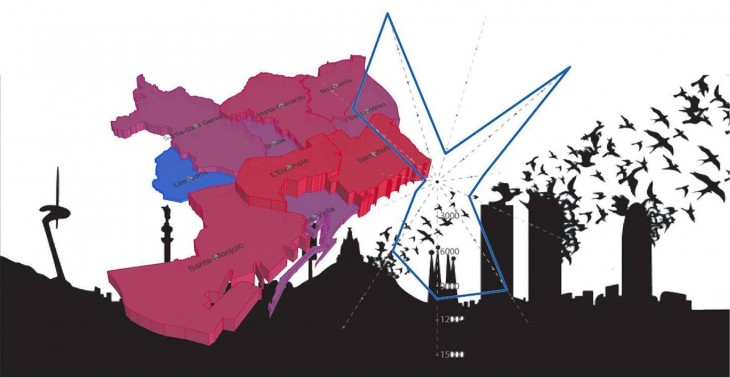
An analysis on the density of Barcelona’s city, the population, unemployment and existing jobs has been
undertaken, in order to contribute to an investigation that will be further developed.
DATA MINING
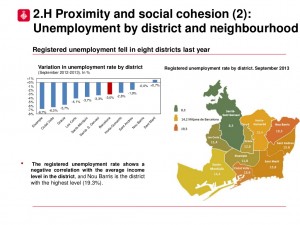
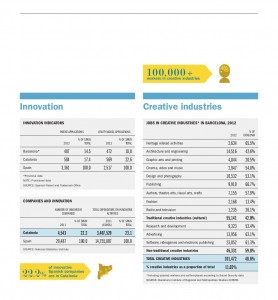
Below are the hyperlinks and screenshots that have been taken from where we extracted the necessary information
in order to visualize our data.
DATA VIZUALIZATION
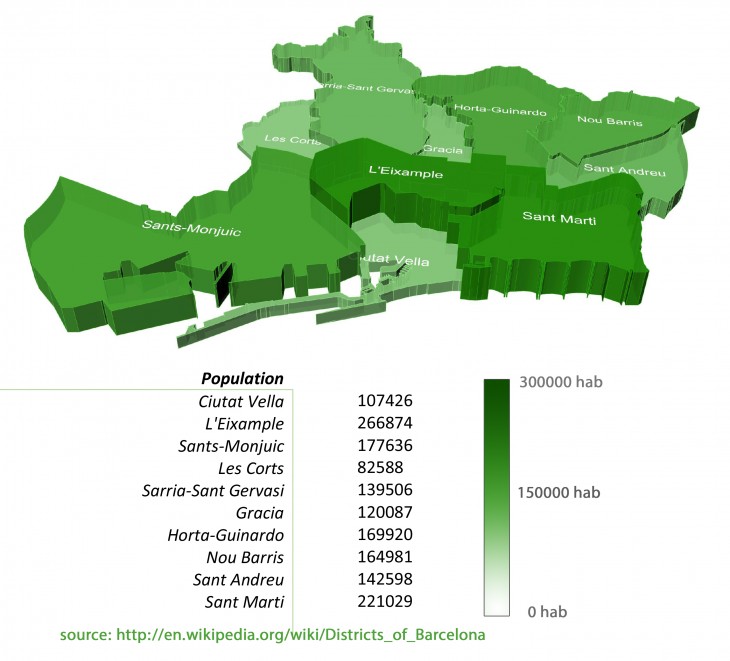
Population
Below is a visual image of the population spread out through 10 districts of central Barcelona.
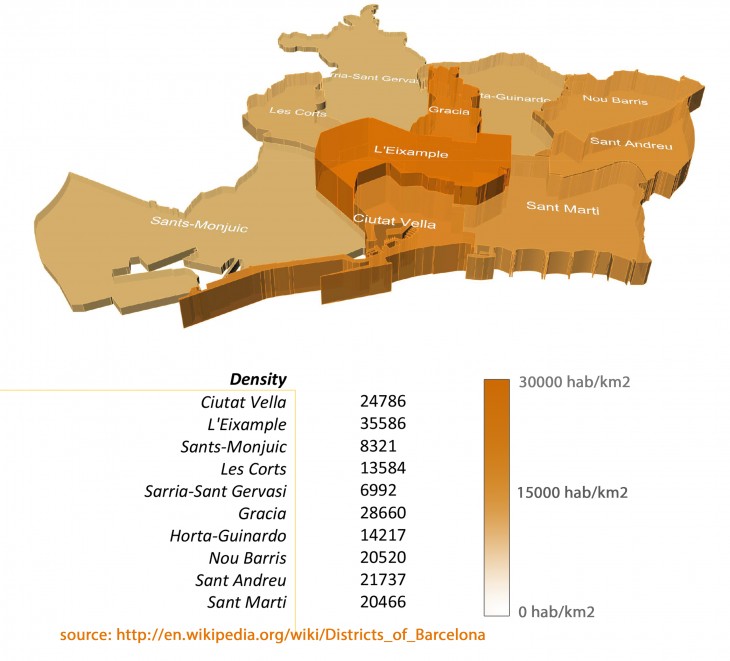
Below is a visual image of the building density within the same districts displayed in the previously slide.
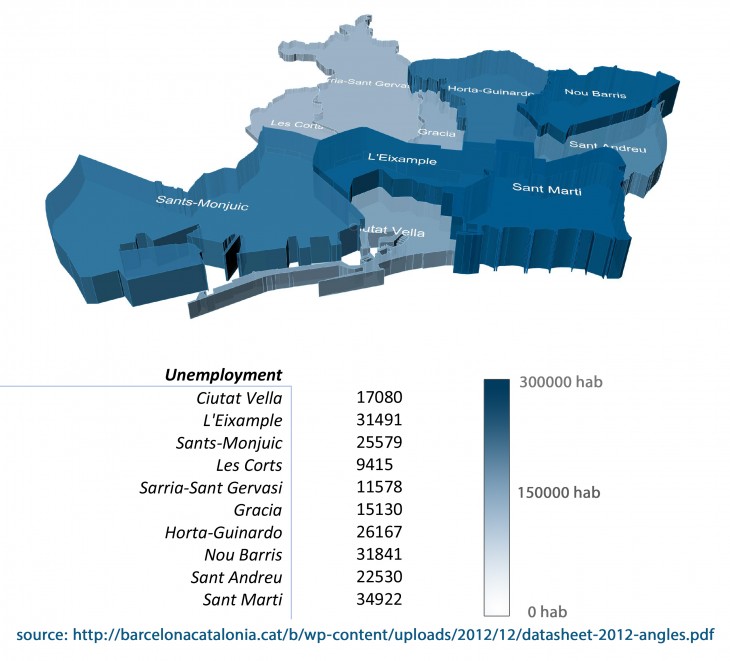
Below is a visual image of the unemployment rate within the 10 districts in the period of 2012.
Employment has marginally increased since 2012.
Jobs created in service:
Jobs created in Industrial:
Jobs created in creative Industries:

