Assignment 2 | Geolocation
Posted in Students Tagged ASSIGNMENT 2, Designing associativity, Jinyang Han, Visualizing Data Comments closed
data visualisation
the grasshopper definition for the data visualisation for the city of New Delhi’s climate data.
the graphic representation for the dew point temperature for one month
the graphic representation for the minimum temperature for one month
the graphic representation for the maximum visibility for one month
STUDENTS:
NEEL KAUL
MEHMET YILMAZ AKDOGAN
SHASHANK SHABADI
Posted in Students Comments closed
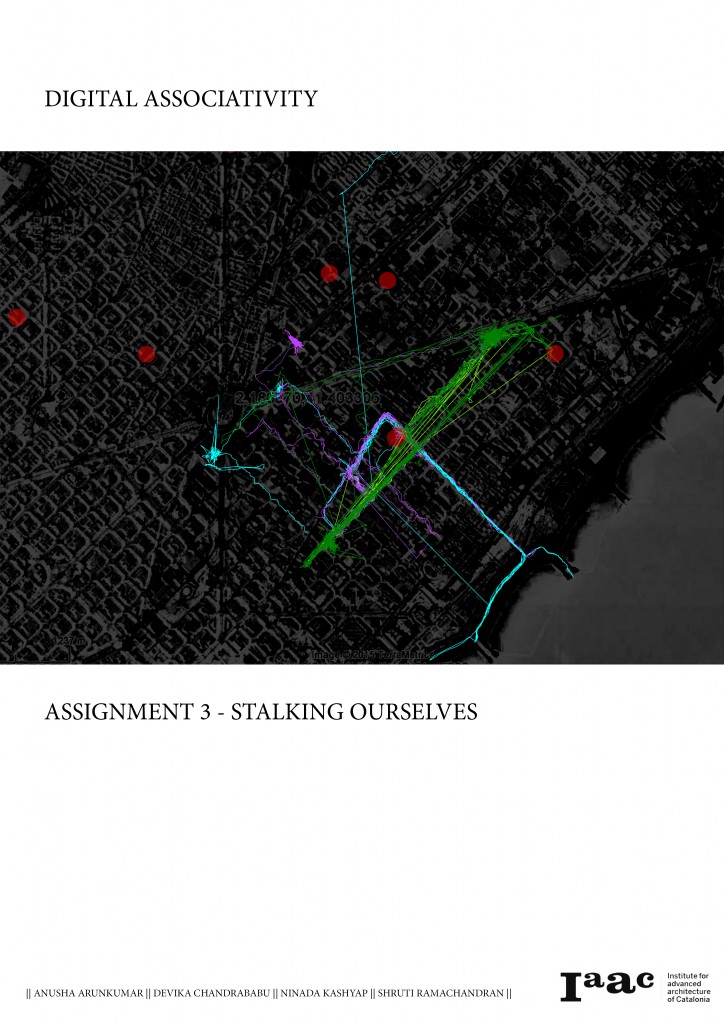
STALKING OURSELVES
Posted in Students Tagged 2015, anusha arunkumar, data mining, devika chandrababu, mapping, mercadona mapping, Ninada Kashyap, shruti ramachnadran Comments closed


