ECOTECT™, Digital Tools Assignment
- 1. Shadows and Reflections
Ecotect™ allows us to see how our future building is going to cast shadows on the surroundings or how do the current buildings cast shadows on each other on a certain day at a certain time or all year round. This helps find the right shape of the building and prevent overshadowing.
To turn on shadows and reflections display we can use the Display tab in the upper panel or F9 and F10 on the keyboard. But for me the easiest way to control and set shadow and reflections is the Shadow Settings Panel on the right side of the window. But before that, of course, we have to load the Weather File. For the Shadows and Reflections exercise (which I did on my Superblock) I chose Barcelona and Seoul to compare.
Daily Sun Path, Barcelona, 1st of December, shadows shown for 15:00, screenshot
Annual Sun Path plus Daily Sun Path and Shadow Range for the 6th of June, Seoul
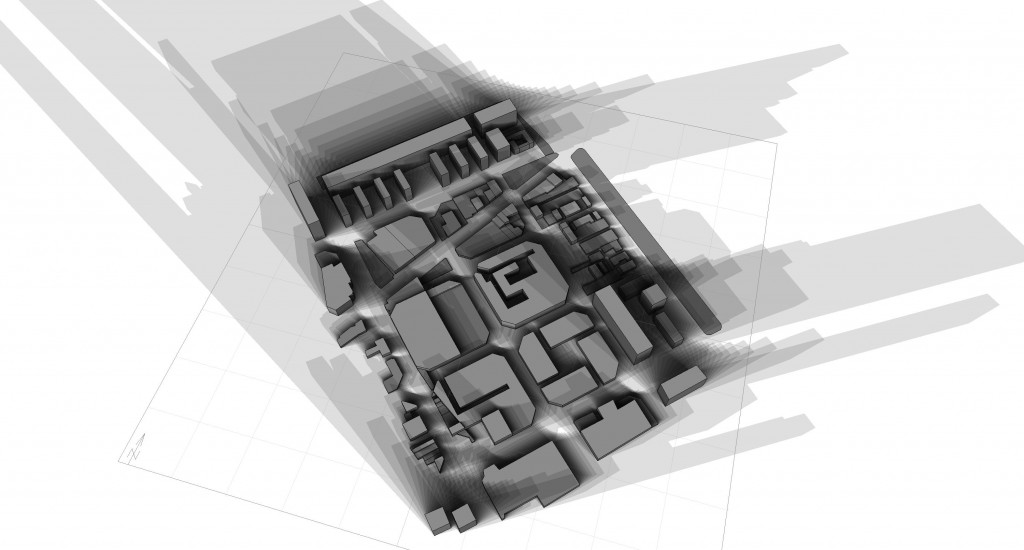
Shadow Range, Barcelona, 25th of November, 8am – 8pm
Reflections with Solar Rays, Barcelona, 20th of September, 14:00
- 2. Solar Radiation
Ecotect™ allows us to analyse solar radiation in a very detailed way. It is very important to consider solar radiation for the projects because it’s the largest source of heat gain in buildings. And of course it is very important, for example, for building with solar panels. In Ecotect™ we can calculate solar exposure and shading mask graphs, check solar availability, calculate available solar radiation for photo-voltaic arrays, etc. For this we use Calculate →Solar Access Analysis →Incident Solar Radiation.
Insolation Analysis, Barcelona, average for the whole year
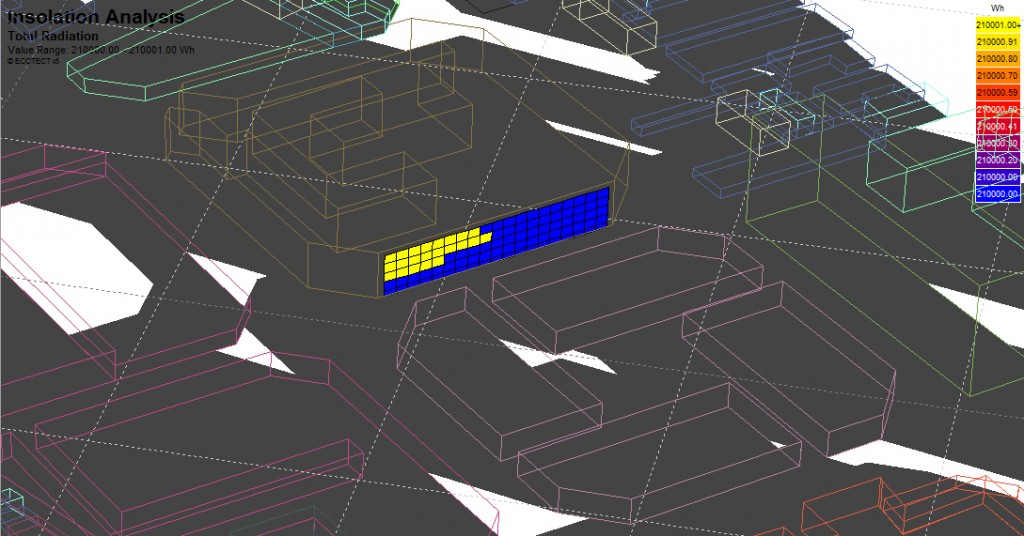
Insolation Analysis, Barcelona, average for spring, 3d Grid
There are several ways to calculate solar radiation in Ecotect™. For example, to calcutate the amount of solar radiation on different areas of a façade of a building we can either divide the surface of the façade into rectangles using the Surface Subdivision function in the Modify tab or we can pull a grid over the façade using the 3d-Form Fit in Auto-Fit Grid to object in the Grid menu on the right.
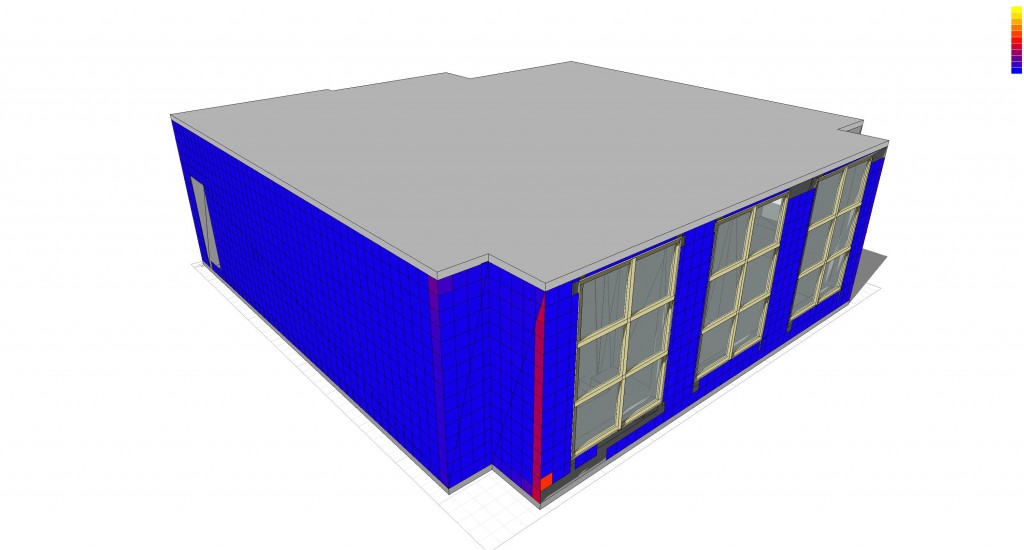
Solar Radiation on a façade, average for November, Moscow, using tiling
Solar Radiation on a façade, Barcelona, 6th of October, 7:45, using a 3d fitted grid
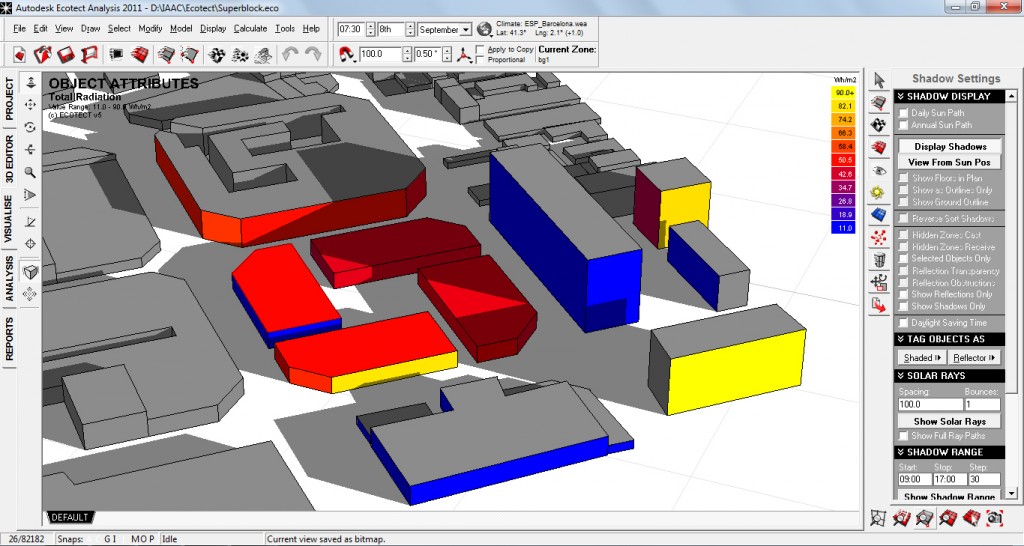
Solar Radiation, average amount of sunlight on different surfaces, Barcelona, 8th of September, 7:30
- 3. Daylight Analysis
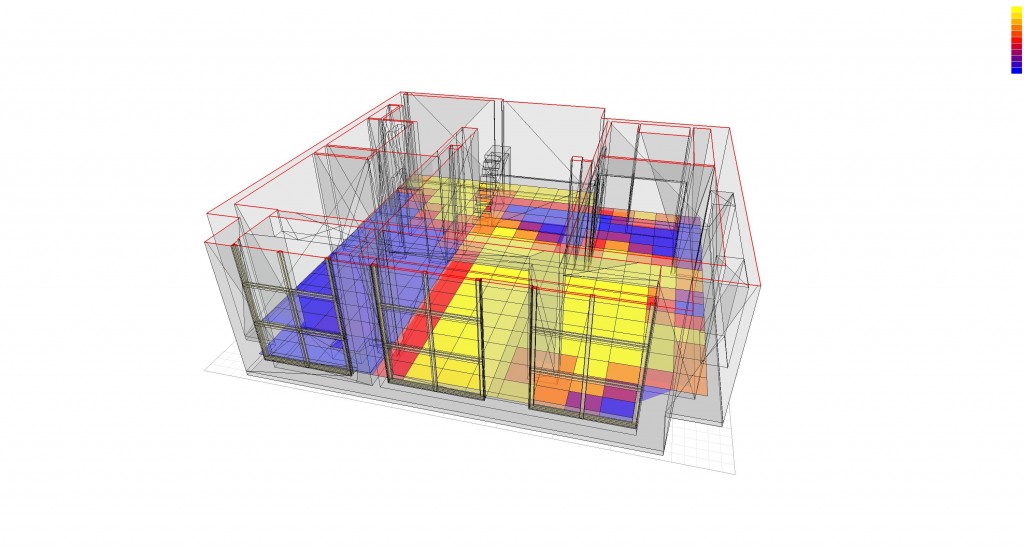
Ecotect™ can be used to visualize the daylighting performance of rooms and spaces in buildings. We can calculate daylight factors for any space, see how much daylight the windows let in and which rooms are more exposed to sunlight at specific days and times. To do this we use the Lighting Analysis in the Calculate tab.
Daylight Analysis, Moscow, 25th of March, 11:00
The same Daylight Analysis but with the grid on another level (higher) in the 3d editor.


