Data Visualizing
Group/ Deepti Dutt-Adhitya Rathinam-John Koshy
Data visualization is a general term that describes any effort to help people understand the significance of data by placing it in a visual context. Patterns, trends and correlations that might go undetected in text-based data can be exposed and recognized easier with data visualization software.
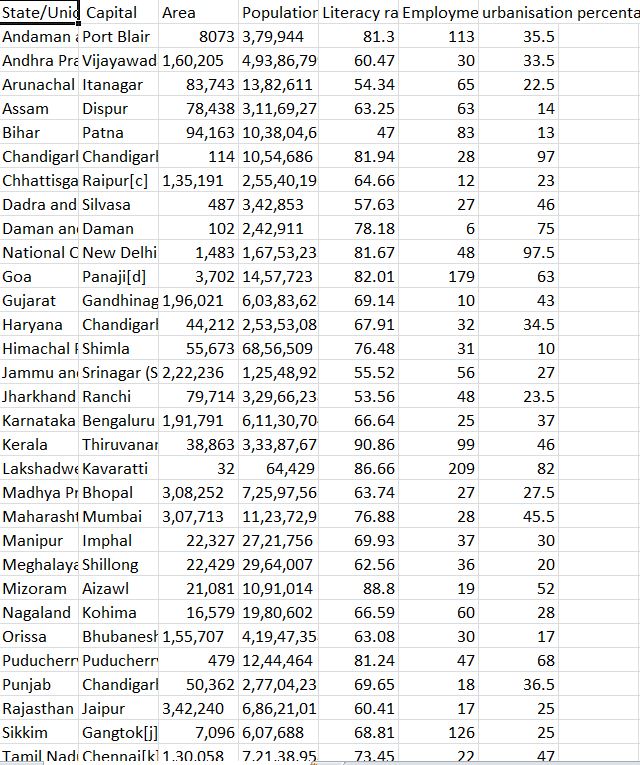
We have taken the statistical data of India in the year 2011 and concentrated on the aspects of Population, Employment , Literacy, Area and Capital.
The exported data is opened in MS Excel and we choose the parameters we want to project. Below is the statistical data of India in the year 2011.
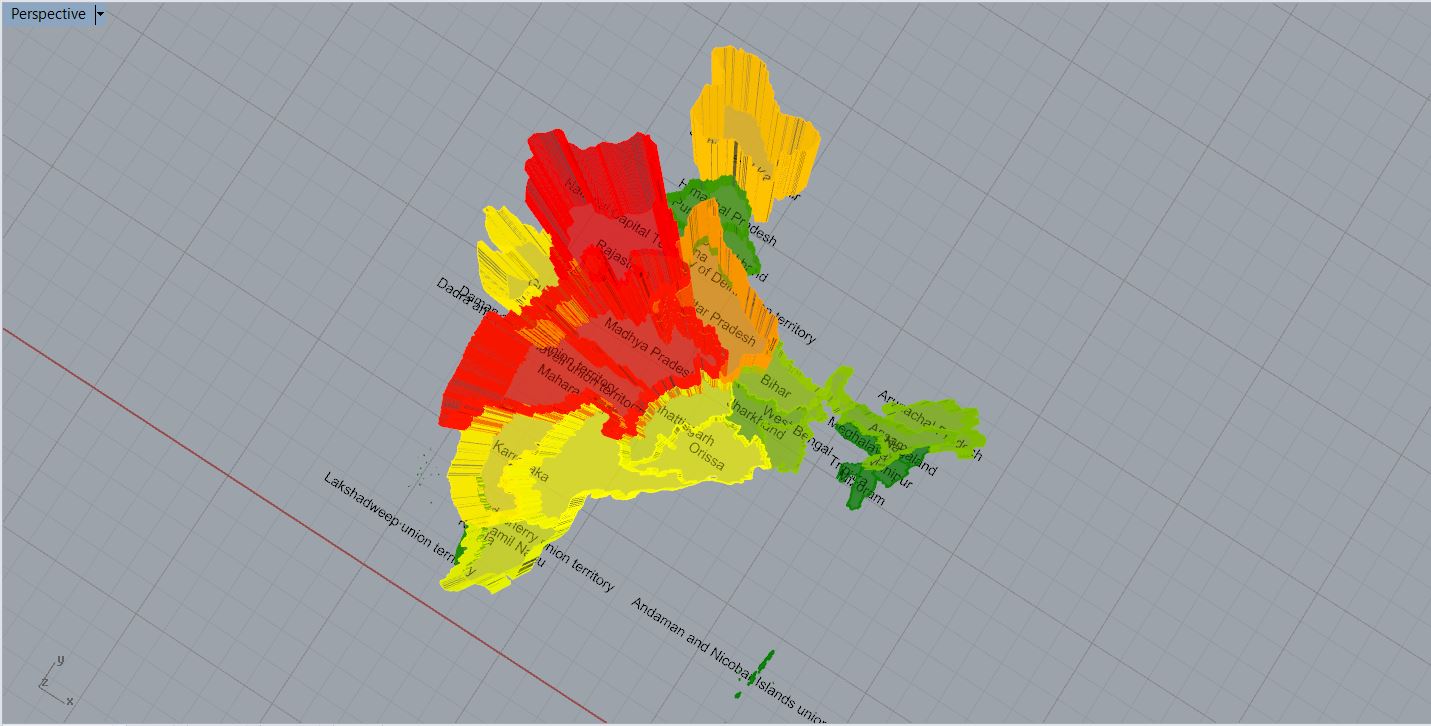
Using the same structure of definition and by changing the slider , we get visualizations of different sets of data in terms of the capital,area,population literacy rate and employment rate.
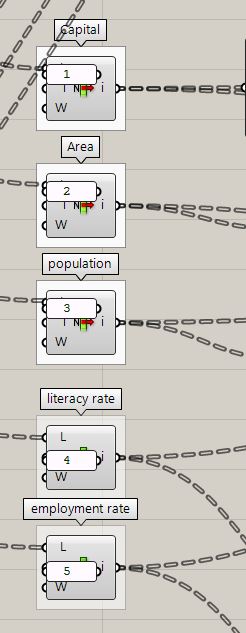


Illustration showing the states with maximum area:
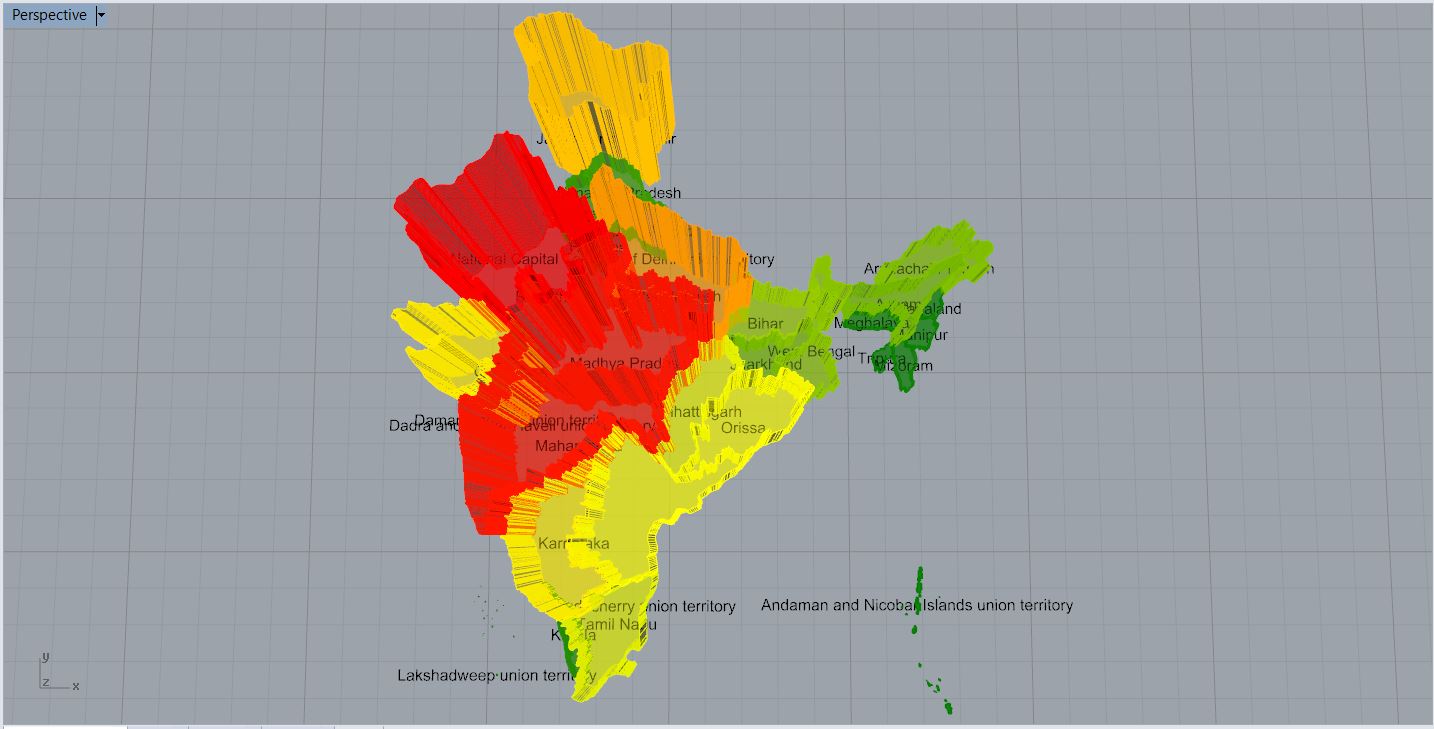

Illustration showing the state employment rates:
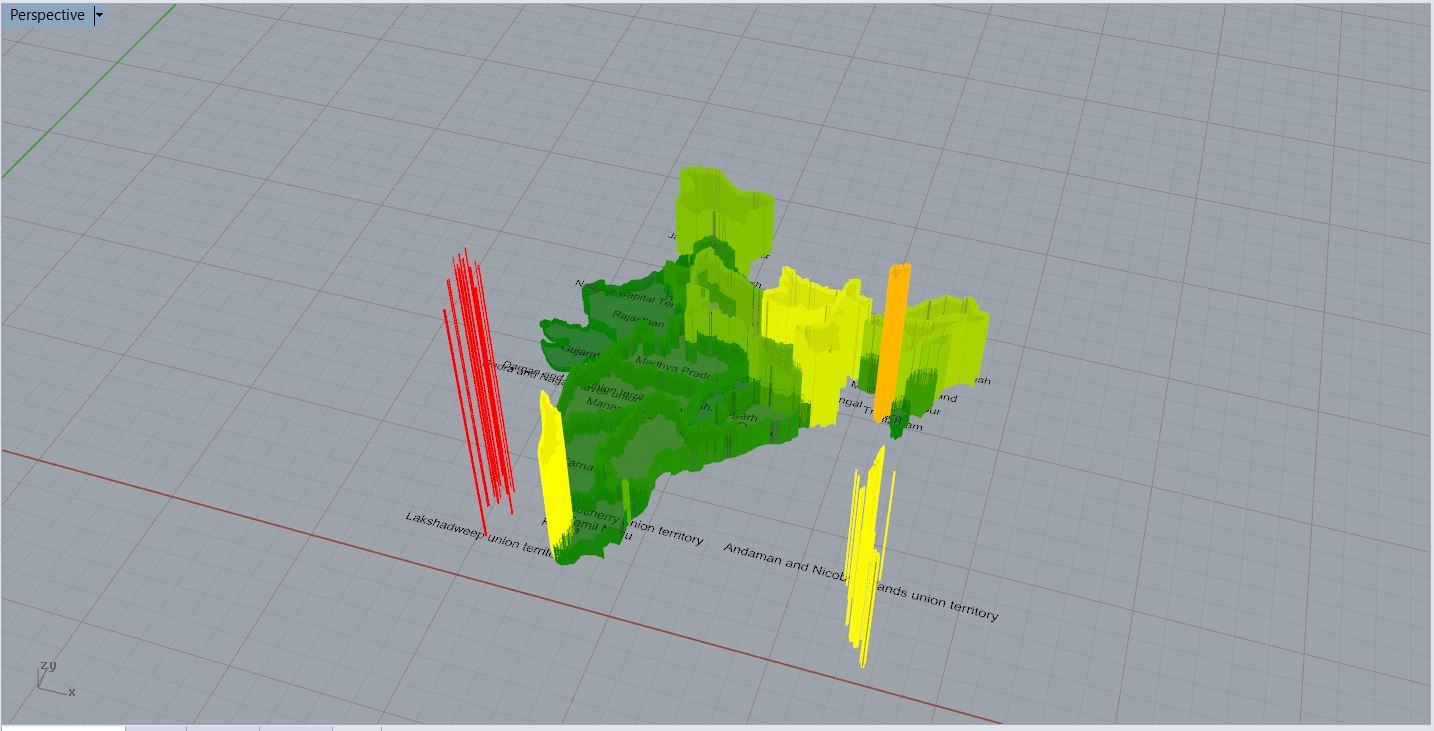
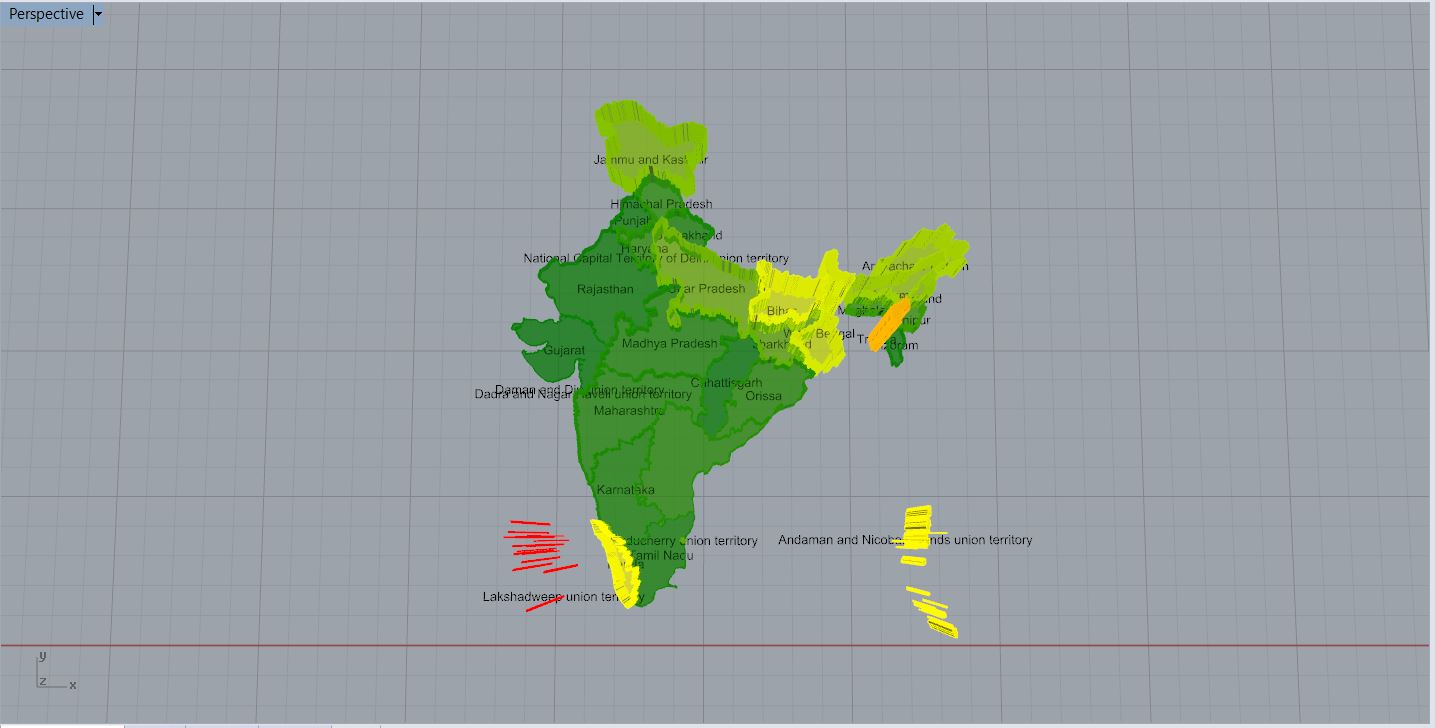
Illustration showing the literacy rates of the various states:
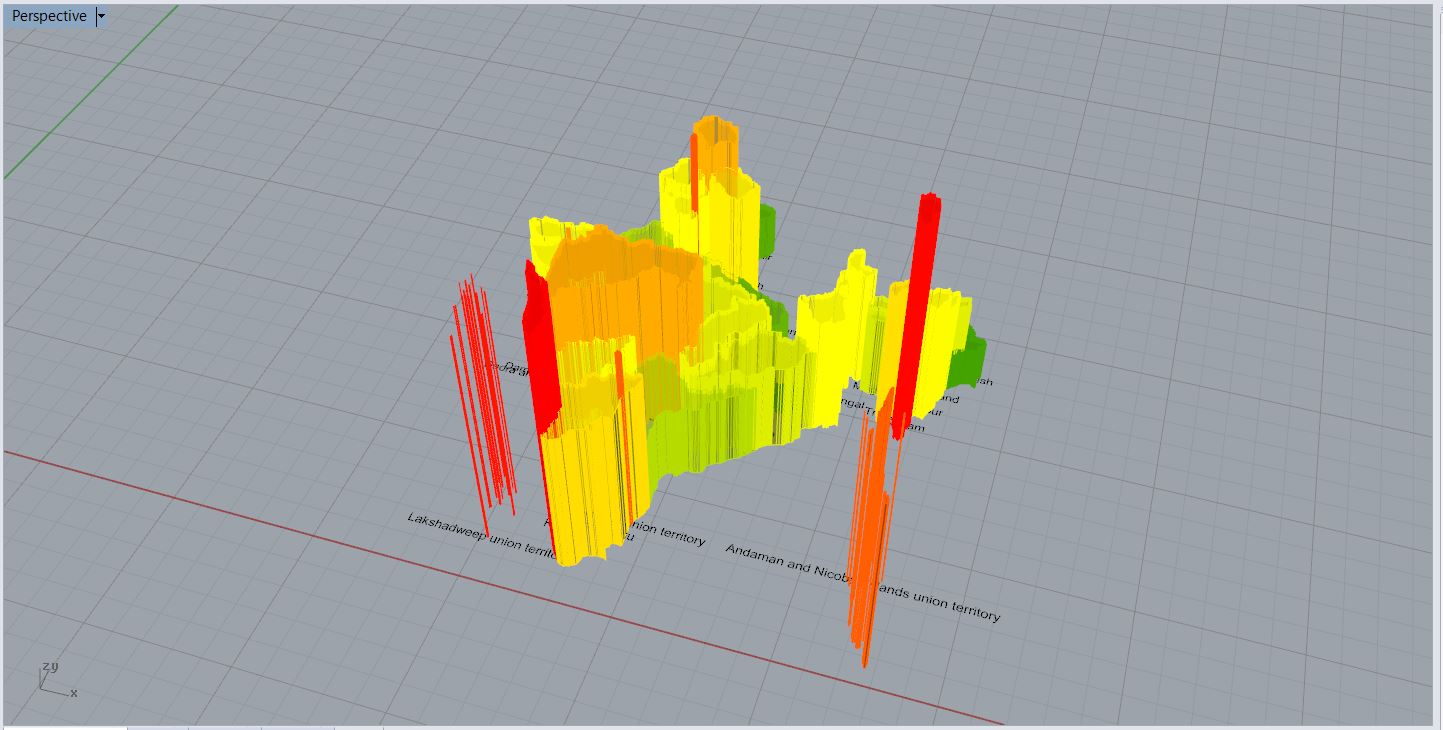
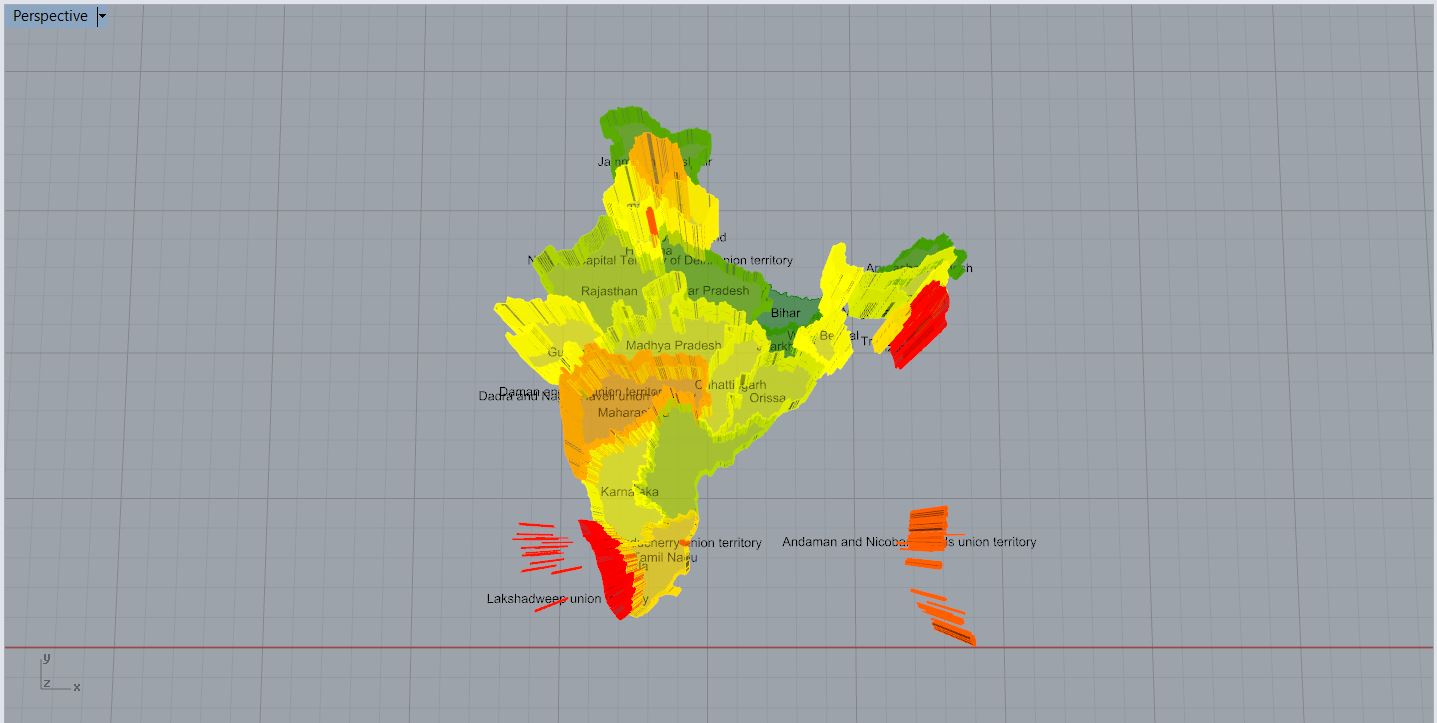
Illustration showing the population density of the various states:
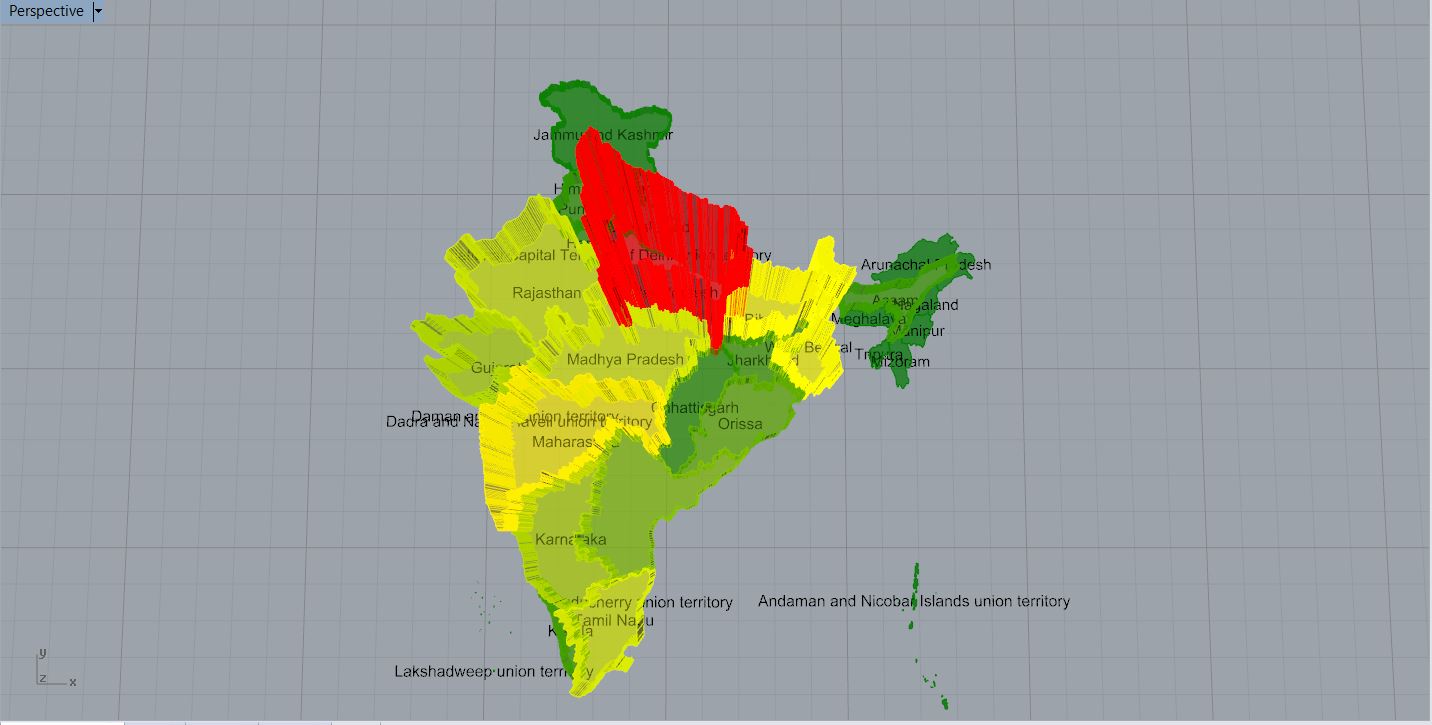
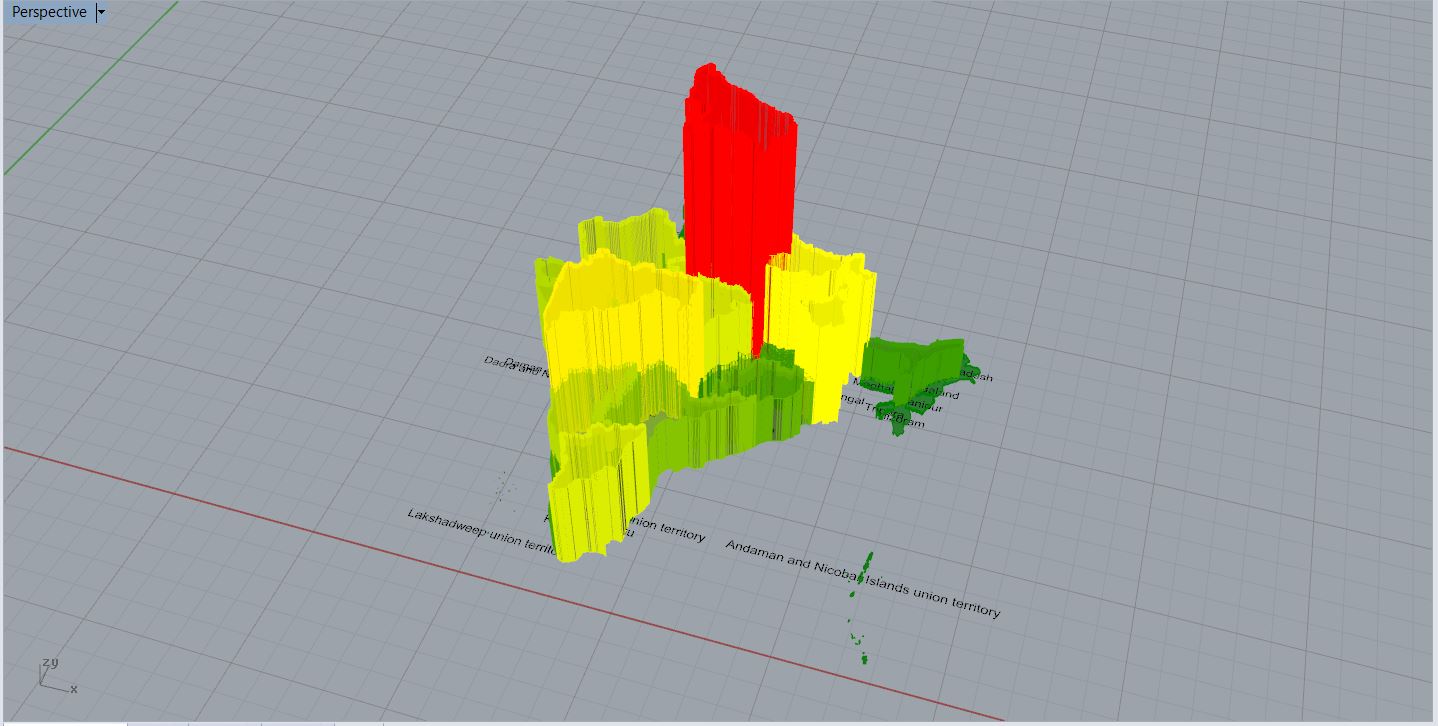
Illustration showing the amount of capital produced in each state: