Monthly Archives: February 2013
Visualizing Data | Housing Area Analysis around Besos
Data Visualization | Growing Apparatus
Growing Apparatus PDF
A.1 Data Visualization. Particles of pollution in Mexico city.
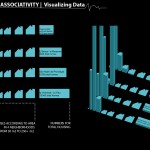
Data Visualization of particles of pollution (Ozone, Nitrogen Dioxide, Carbon Monoxide and Sulfure Dioxide) along year of 2012 in Mexico City. The graphics showed belowed were generated with grasshopper and the data was collected with a .CSV file according to www.calidadaire.df.gob.mx . Each color represents a particle of pollution and the size increase according to [...]
First Assignment A.Díaz + R.Garita + A.Sollazo + M.Valenzuela
The City of Barcelona | transformation of a local economy KNOWLEDGE ECONOMY GDP SPAIN In 2006, the Spanish GDP exceeded the EUR 873,000 million, being the region of Catalonia the main contributor of all of Spain. A ECONOMIC ACTIVITIES The City of Barcelona has a longstanding manufacturing and industrial tradition that has been adapting to [...]
Visualizing Hemp Behaviour
Aim of the first Designing Associativity exercise is to develop graphic, visualizing re-presentation of hemp seeds germination mapping ( project developed on Research Studio – Digital Tectonics / Fabrication Ecologies ). Laboratorial Germination Apparatus investigates comparative technique which displays different conditions for hemp seeds germination. Each Petri dish has diverse environmental conditions based on different [...]
