Category Archives: Miguel Oliveira

A.3 Design Well Travelled – Multi-objective Optimization

1. PROBLEM STATEMENT

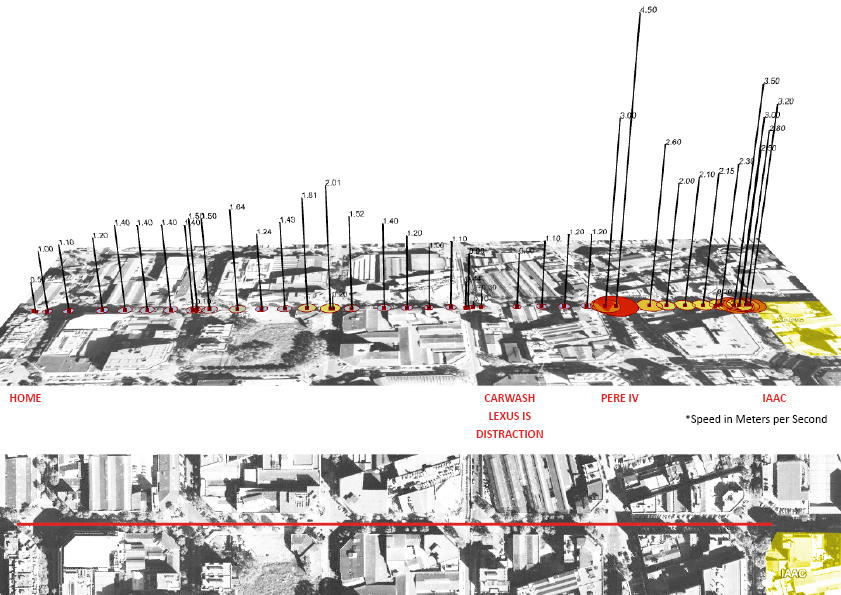
1. Establish a Physical and Visual Link between Park – Site – Sea
2. Build a Covered Market based on a roof surface
3. Turn the building into a Power Plant using PV panels
2. DESIGN AND OPTIMIZATION

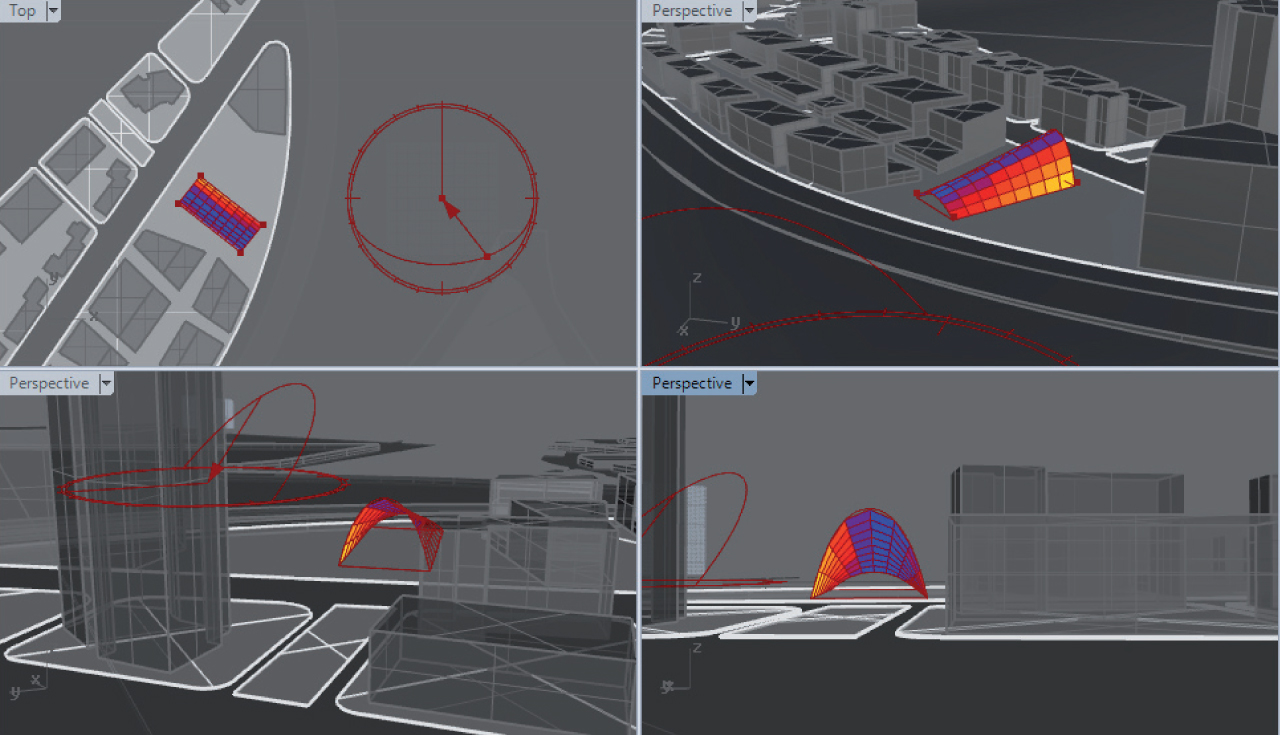
Once the design constraints regarding the direction of the building were established, the open design constraints remain as the height and shape of the parabolas that will define the market´s roof.
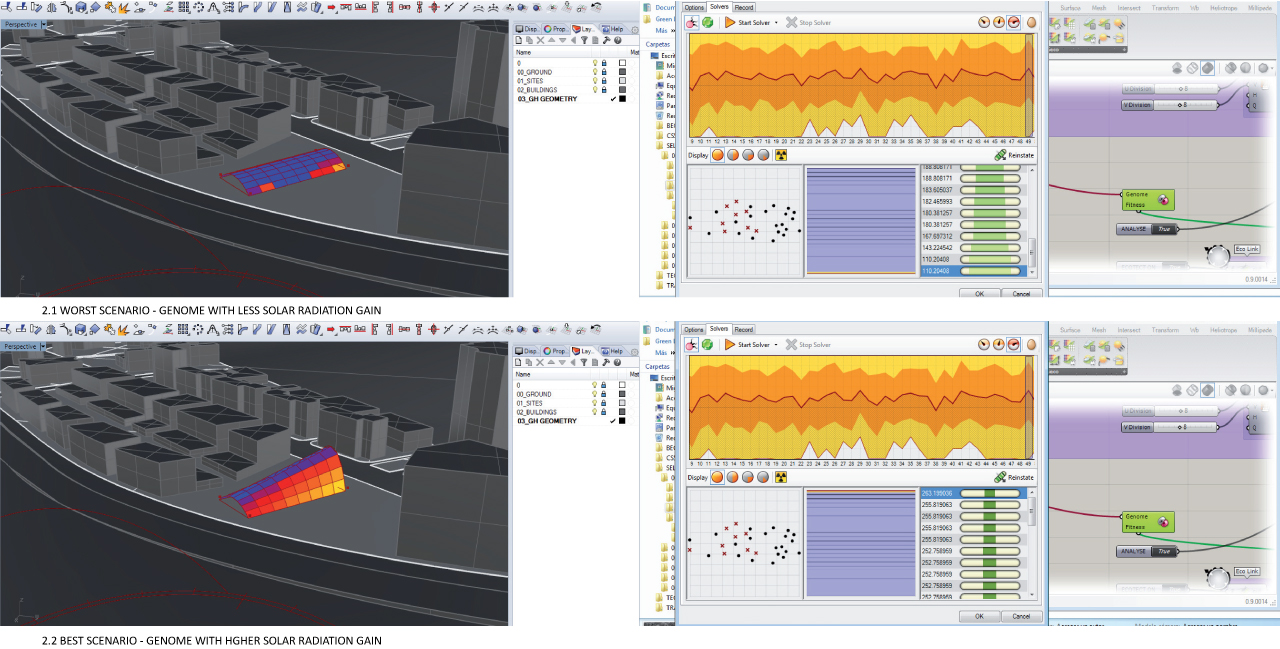
Galapagos is used in connection with Geco-Ecotect to look for the solution that maximizes solar radiation gains on the roof-surface, thus optimizing a design driven by energy performance.
3. CONCLUSION

The best solution reflects a higher building, less flat surface, which is also interesting as it
generates a gate facing the Rambla, which welcomes customers to the new Market.
Posted in Miguel Oliveira | Comments closed

Geolocated – Stalking Yourself – Miguel Oliveira + Marjan Jelveh

Everymorning we wake up and go to work or to school.
What is the average speed a person achieves during that route, and how is it affected by obstacles or distractions such as traffic or beautiful visions…
Data was obtained from myTrack app for Android on a smartphone. The app registered via gps the position and speed of the subject during the route from his house to IaaC University in Barcelona.
From the vizualizing results some conclusions were drawn:
Conclusion 1: At some zebra crossings the subject stops when the sign is red
Conclusion 2: At a local Carwash the subject reduces speed to look at a Lexus IS
Conclusion 3: At Pere IV he increases speed to cross the dangerous big avenue
Conclusion 4: Near Pujades the subject speeds up because he´s late
Vizualization Strategy and Tools:
1 – Get Ortophotomap from Google Earth with two referenced GPS points
2 – Import Map in Rhino and scale it to real size
3 – Draw points in Rhino on referenced points from map, and assign them in Grasshopper
4 – Assign referenced points in Grasshopper GPS coordinates and with Ghowl reference them to global GPS system
5 – Import in Grasshopper data file containing GPS tracked points and speed
6 – Arrange data file, sorting and listing position and speed items
7 – Assign circles and color meshes to each tracking point, the wider the circle and the redder the color,the bigger the speed
8 – Assign vertical line and 3dtext to indicate exact speed at each point
Also posted in Marjan Jelveh Nejad | Comments closed

Datascape – House Cost/m2/City

Suppose you want to buy a house in Spain.
First you would look at the prices per square meter of each major city and compare them. The objective of an analysis tool to make that process easier would be to establish a visual link between that cost per m2 and the geographic position of each major city.
0. BACKGROUND
Looking into Ben Fry´s Phd Thesys “Computacional Information Design”, MIT 2004,  one can realize the potential of communicating large ammounts of complex data in a visual way. To represent it one needs an adequate tool and to think of a proccess/strategy to handle that data, mainly consisting of two steps:
1 – obtaining and preparing/arranging Data
2 – representing that data
Ben Fry describes it in the following sequence:
acquire – parse – filter – mine – represent – refine – interact
It is important that the person that gets the data and prepares it is the same that the one who represents it. There´s an important connection between preparing data and linking it in a visual tool, in terms of translating the data, like in the case of Grasshopper for this exercise.
1. GETTING DATA
The first step was obtaining reliable data, to do so I accessed Ministerio de Fomento online and downloaded excel datasheets containing cities and houses price per m2 in Spain. The second step was deleting minor cities and irrelevant data. The third step was ordering cities alphabetically and saving excel files to import later in GH.
For the visualization strategy I followed this sequence:
Step 1 – Draw Spain and major cities in Rhino as points
Step 2 – Importing points representing major cities in Grasshopper
Step 3 – Importing Excel Datasheets with Ghowl
Step 4 – Generate new point heights from cost values in excel
Step 5 – Create mesh, datascape, from new points with a color gradient scheme
The high peaks and red colour stains show more expensive cities
2. CONCLUSION
As expected, cost increases with proximity to the coast, France and Madrid.
In further study, it could be interesting to determine if the yellow spots connecting vertexes (cities) reflect road or infrastructure pathways.
Sources:
www.fomento.es
http://benfry.com/phd/
Posted in Miguel Oliveira | Comments closed