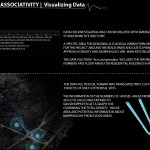
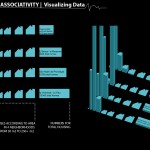
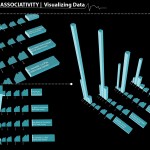
A visualization of the number of species for each fauna category that exists in Barcelona’s urban area for a better understanding of the urban biodiversity and variety of the city.
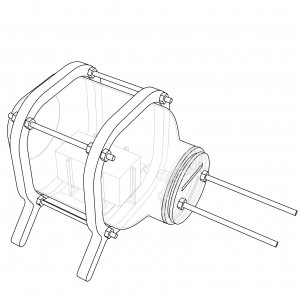
Data Visualization | Growing Apparatus
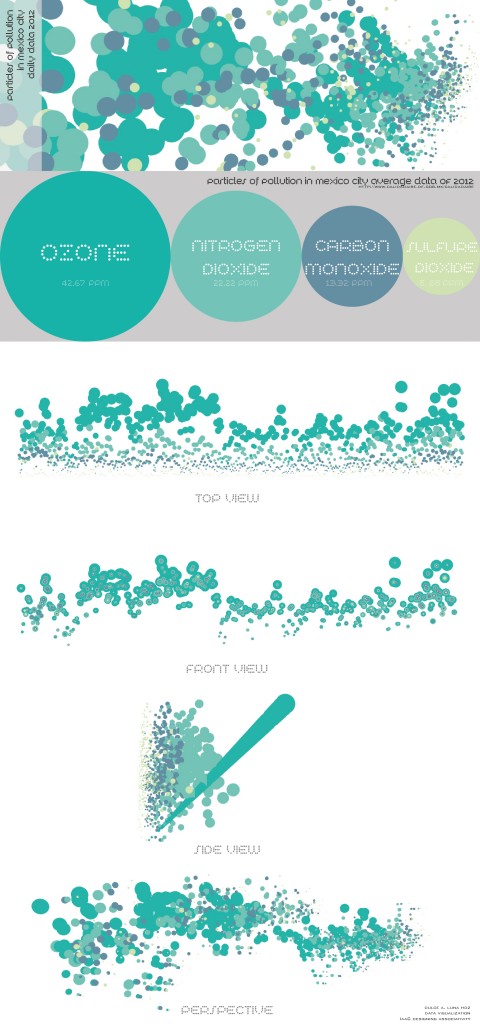
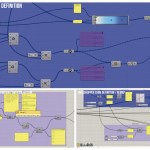
A.1 Data Visualization. Particles of pollution in Mexico city.
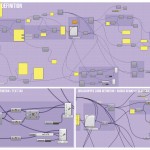
Data Visualization of particles of pollution (Ozone, Nitrogen Dioxide, Carbon Monoxide and Sulfure Dioxide) along year of 2012 in Mexico City. The graphics showed belowed were generated with grasshopper and the data was collected with a .CSV file according to www.calidadaire.df.gob.mx .
Each color represents a particle of pollution and the size increase according to the amount of ppm of every day.
First Assignment A.Díaz + R.Garita + A.Sollazo + M.Valenzuela
The City of Barcelona | transformation of a local economy
KNOWLEDGE ECONOMY
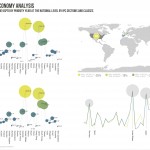
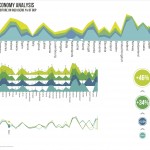
gdp spainIn 2006, the Spanish GDP exceeded the EUR 873,000 million, being the region of Catalonia the main contributor of all of Spain. economic activitiesThe City of Barcelona has a longstandingmanufacturing and industrial tradition that has been adapting to the challenges posed by the knowledge-based economy. While Barcelona was traditionally known for automotive, chemical, textile, food processing, publishing and consumer electronics industries, these activities have almost entirely moved to thecity suburbs. The evolution of the economic activities of the City of Barcelona focused around the tertiary sector.business environmentIn 2007, the province of Barcelona was the host to more than 470,000 enterprises. This represents 14% of the total number of companies in Spain and 76.3% of Catalonia’s total. The business sector in the City of Barcelona is formed in its majority by small and medium-sized enterprises (SMEs, between 0 and 199 workers). The business-friendly environment of Barcelona is illustrated by the dynamic rate of net business creation. In 2006, the province of Barcelona registered a net growth of 25,022 companies, 15.4% of Spanish net business creation in 2006.A
source: OECD. (2009). Promoting entrepreneurship, employment and business competitiveness. Barcelona. OECD Leed Programme


