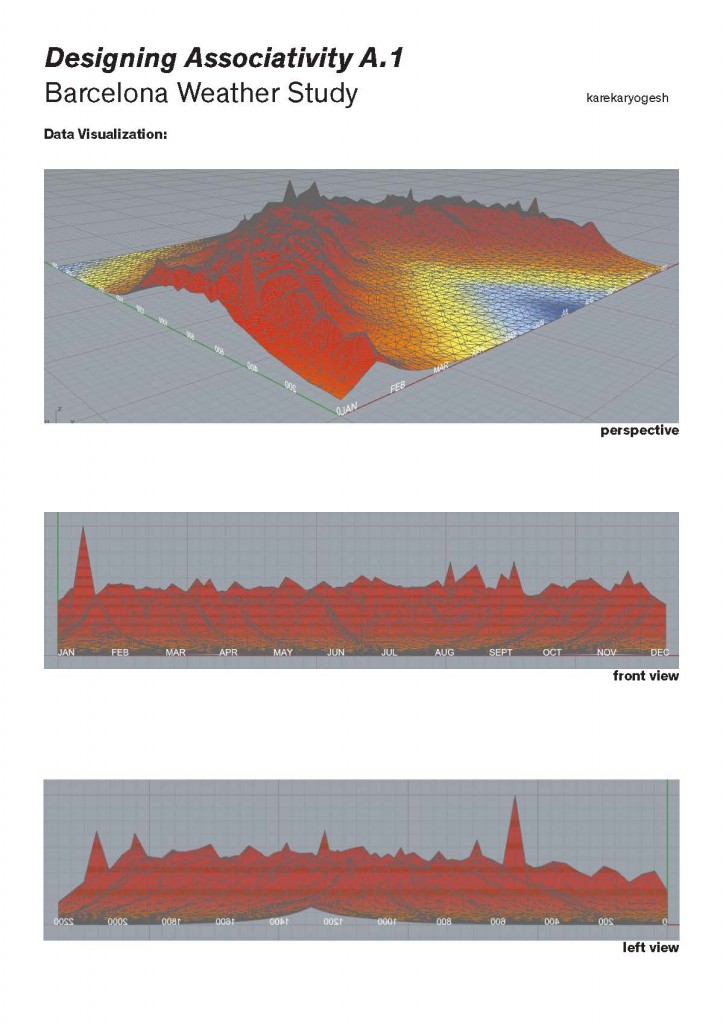
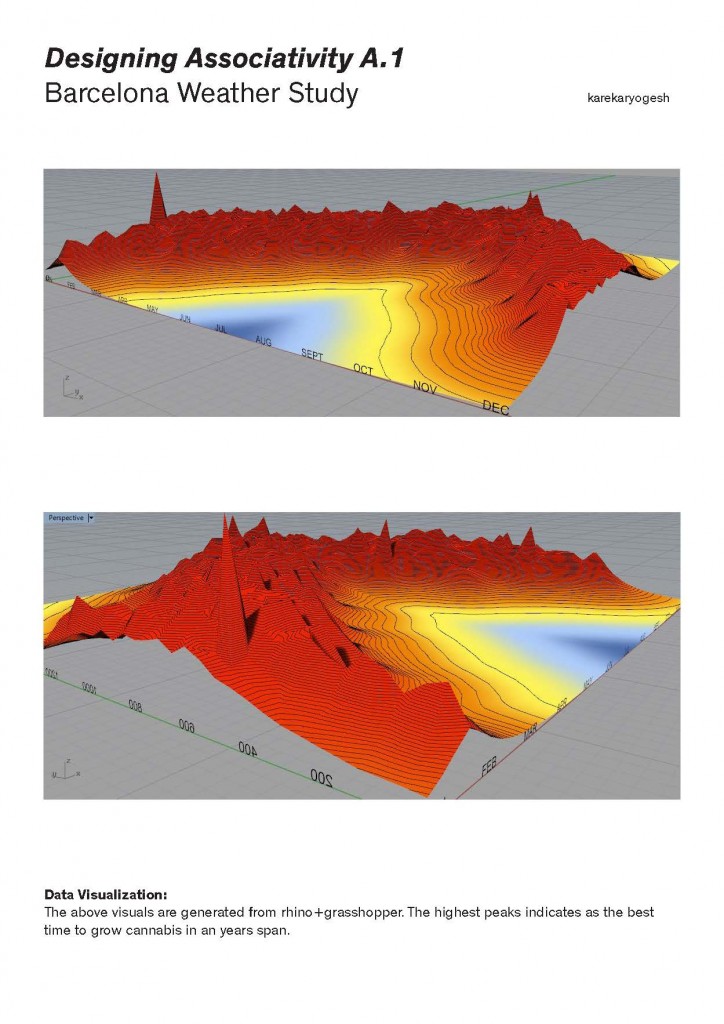
A1 Visualising Data

Posted in Yogesh Karekar | Comments closed

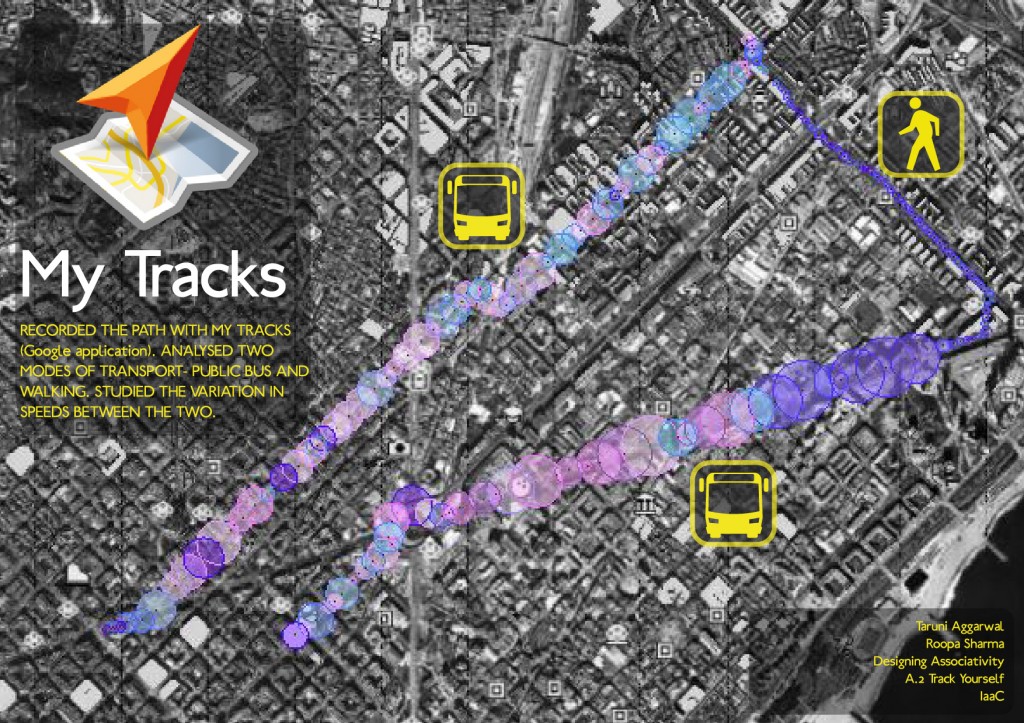
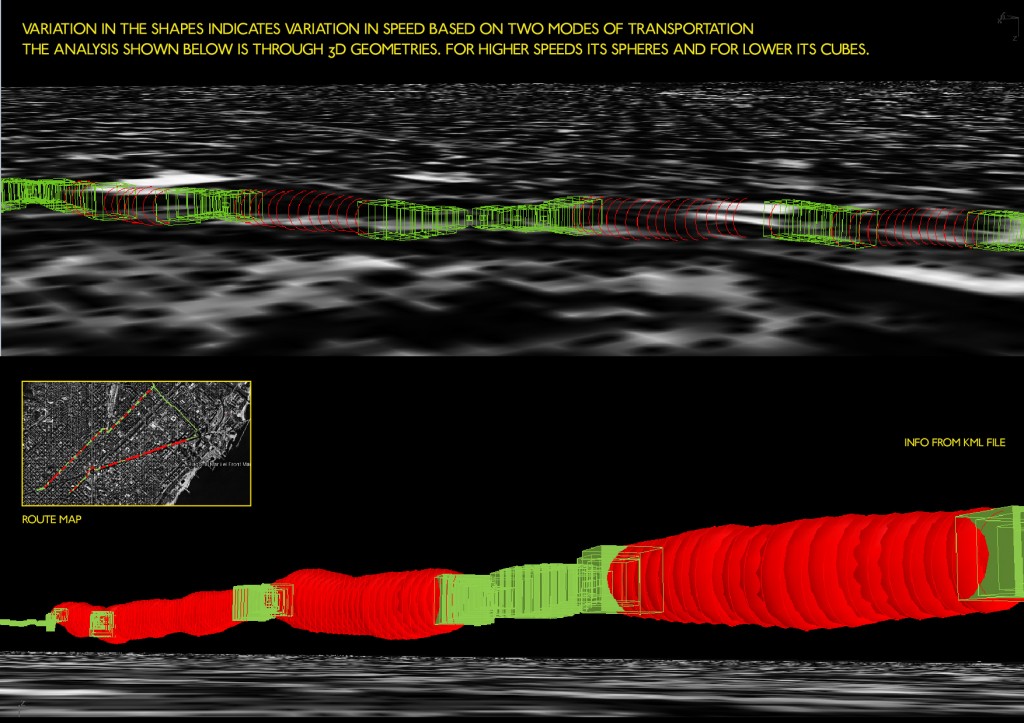
A2. Track Yourself . Taruni Aggarwal + Roopa Sharma

Posted in Roopa Sharma, Taruni Aggarwal | Comments closed

TRACKING THE FLOWS

ANALYSIS OF DATA AND GEOLOCATION

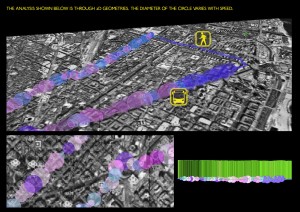
Life and social environment is a dynamic force. It is an inspiration for understanding and working in different areas of architecture. This parametric field is not a static entity but a new vision that is in a constantly fluxing state of spatial relations via dynamic environmental forces. In this experiment I tracked myself with two different apps: Antimap and Mytracks. Those apps gave me data regarding latitude, longitude, speed and altitude and with Gh and Google Earth I visualized by flow diagrams. A path made every day on the motorbike, from the neighborhood of Gracia to Poble Nou, from my house to IaaC and vice versa,different flows depending on the speed, the green/red light and the traffc present. With different routes we can create a new landscape of Barcelona governed by fast flows of people that every day are moving in this organism.

Posted in Levidis Stefanos, Niccolo Marini | Comments closed

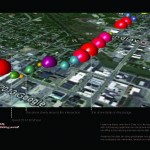
Geolocated – Stalking Yourself – Miguel Oliveira + Marjan Jelveh

Everymorning we wake up and go to work or to school.
What is the average speed a person achieves during that route, and how is it affected by obstacles or distractions such as traffic or beautiful visions…
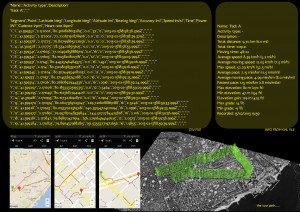
Data was obtained from myTrack app for Android on a smartphone. The app registered via gps the position and speed of the subject during the route from his house to IaaC University in Barcelona.
From the vizualizing results some conclusions were drawn:
Conclusion 1: At some zebra crossings the subject stops when the sign is red
Conclusion 2: At a local Carwash the subject reduces speed to look at a Lexus IS
Conclusion 3: At Pere IV he increases speed to cross the dangerous big avenue
Conclusion 4: Near Pujades the subject speeds up because he´s late
Vizualization Strategy and Tools:
1 – Get Ortophotomap from Google Earth with two referenced GPS points
2 – Import Map in Rhino and scale it to real size
3 – Draw points in Rhino on referenced points from map, and assign them in Grasshopper
4 – Assign referenced points in Grasshopper GPS coordinates and with Ghowl reference them to global GPS system
5 – Import in Grasshopper data file containing GPS tracked points and speed
6 – Arrange data file, sorting and listing position and speed items
7 – Assign circles and color meshes to each tracking point, the wider the circle and the redder the color,the bigger the speed
8 – Assign vertical line and 3dtext to indicate exact speed at each point
Posted in Marjan Jelveh Nejad, Miguel Oliveira | Comments closed

[Designing Associativity] Marisa Charusilawong – A.2

Posted in Marisa Charusilawong | Comments closed