Category Archives: Students

computer vision. the cage

“La Gabbia” (The Cage) by auroraMeccanica (2011) is an installation that uses projection to invite the public to interact with physical bird cage to trigger the release of projected birds. At the center of a darkened room, a birdcage hanging from the ceiling it’s lit only by the white beam of the projector and its on the wall. Uncover the bird’s presence through playing a game, a very simple game in which we just have to push the cage and shake it.

I found this beautiful project here

La Gabbia – auroraMeccanica – videoinstallazione interattiva from auroraMeccanica on Vimeo.

Also posted in Gerda Antanaityte, Int Programming, References | Tagged , | Comments closed

My favorite computer vision project

My all-time favorite computer vision project is Text Rain by Camille Utterback & Romy Achituv. Hard to believe that this was done in 1999, long before the Kinect made this much easier.

It was created at ITP, and when I had the chance to spend some time there I did small hommage to this installation. This version uses a Kinect and Box2D. Creative Applications has a nice tutorial on how to do this in Processing.

Also posted in Bert Balcaen, Int Programming, References | Comments closed

Face recognition

The Viola-Jones algorithm is one of most common computer vision techniques to detect faces. Greg Borenstein did a nice interview with Adam Harvey where they talk about the underlying assumptions in the technique. Everything is explained clearly, so it’s great if you want to learn a little more about what happens behind the scenes.

Harvey did some interesting work on how we can circumvent face detection using makeup and hairstyles.

Also posted in Bert Balcaen, Int Programming, References | Comments closed

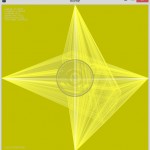
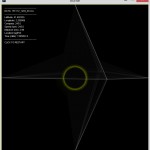
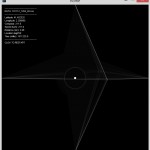
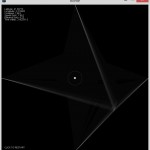
visualizing data. Playing with interface


Also posted in Exercises, Gerda Antanaityte, Int Programming | Tagged , , | Comments closed

visualizing data. process

How does your movement look like?
The challenge was to find creative way to translate GPS data into visual form.

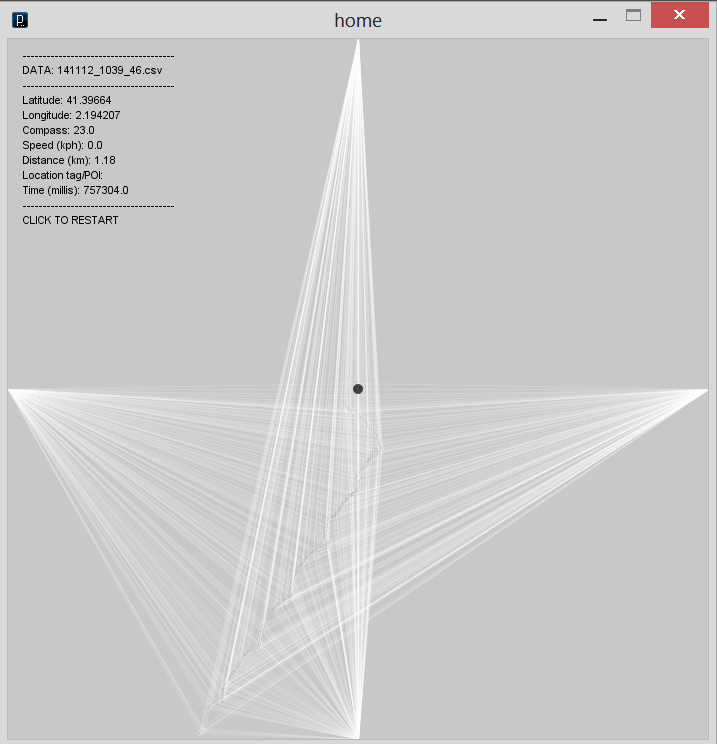
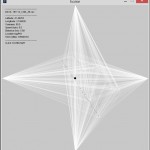
The idea is quite simple. What is home?  Probably it’s your center of the world. Every journey starts and ends here.  I picked  my home as initial point and marked it as origin of the drawing. Movement is illustrated by stretching coordinate lines. In that case you can always see how far you are from initial point.

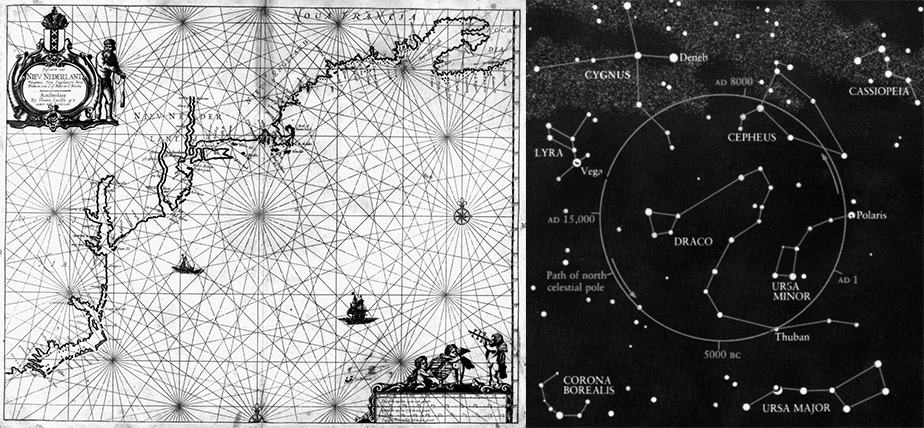
Nautical and celestial cartography, where relations between objects are clearly linked in simple and aesthetic manner were inspiring graphic forms:
first concept sketches
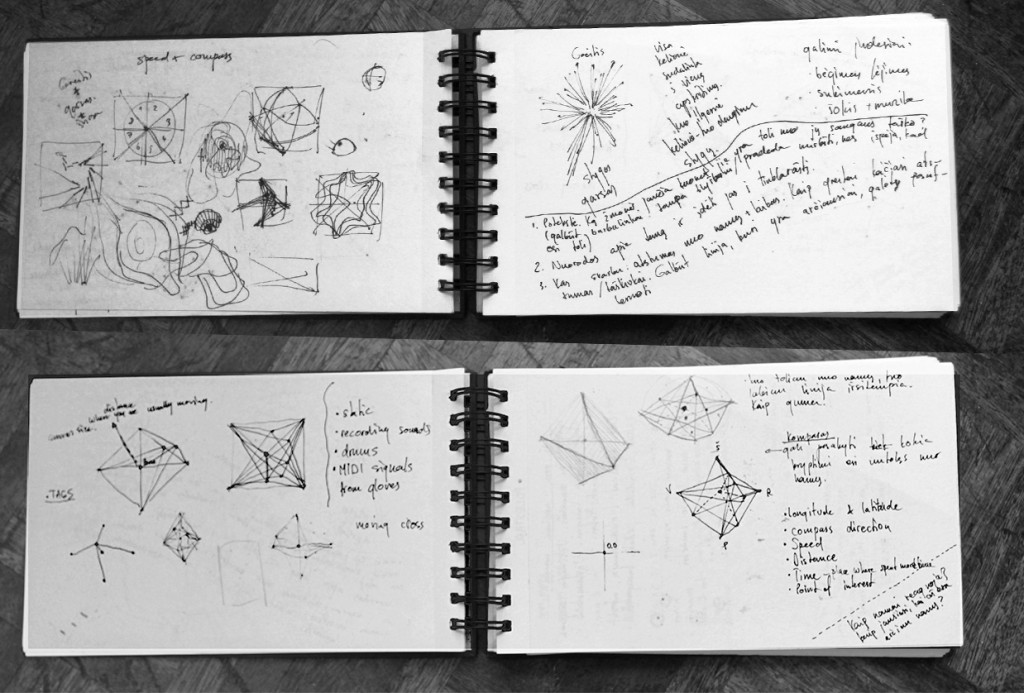
and here’s how my interface sketch looks like.
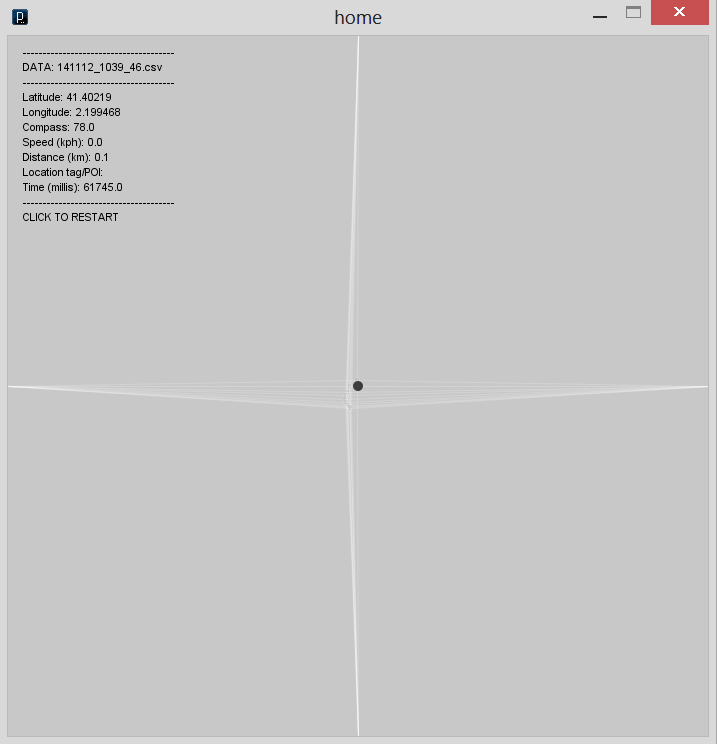
My first recording started from home to school. I used antiMap application, which gathered data about speed, distance, time, compass position, longitude and latitude. It was interesting experience to see this trip visualized. Somehow it looked like personal documentary cartoon. Here’s how my trip looked like:
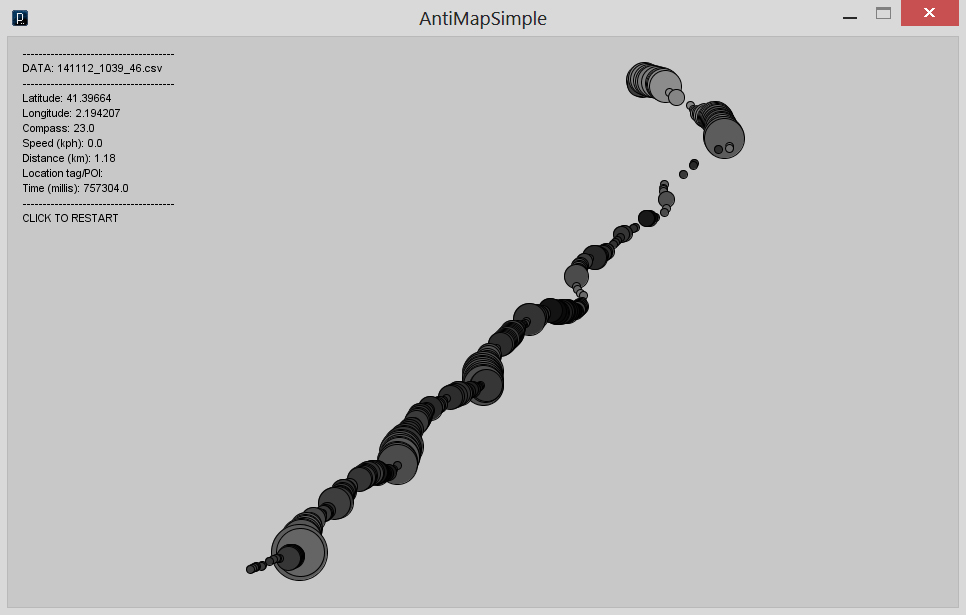
Size of ellipse represents speed, color changes are compass position. Even there’s no information about streets, from speed and ellipse position you can clearly define where are crossroads with traffic lights. I never thought how my trip would look like. It shows how maps can be informative as well creative by invoking different tools.

In example you can see only one way trip, but tomorrow I will go to the beach and probably come back home :) It will help to complete my map.

Also posted in Exercises, Gerda Antanaityte, Int Programming, References | Tagged , , | Comments closed