Suppose you want to buy a house in Spain.
First you would look at the prices per square meter of each major city and compare them. The objective of an analysis tool to make that process easier would be to establish a visual link between that cost per m2 and the geographic position of each major city.
0. BACKGROUND
Looking into Ben Fry´s Phd Thesys “Computacional Information Design”, MIT 2004, one can realize the potential of communicating large ammounts of complex data in a visual way. To represent it one needs an adequate tool and to think of a proccess/strategy to handle that data, mainly consisting of two steps:
1 – obtaining and preparing/arranging Data
2 – representing that data
Ben Fry describes it in the following sequence:
acquire – parse – filter – mine – represent – refine – interact
It is important that the person that gets the data and prepares it is the same that the one who represents it. There´s an important connection between preparing data and linking it in a visual tool, in terms of translating the data, like in the case of Grasshopper for this exercise.
1. GETTING DATA
The first step was obtaining reliable data, to do so I accessed Ministerio de Fomento online and downloaded excel datasheets containing cities and houses price per m2 in Spain. The second step was deleting minor cities and irrelevant data. The third step was ordering cities alphabetically and saving excel files to import later in GH.
For the visualization strategy I followed this sequence:
Step 1 – Draw Spain and major cities in Rhino as points
Step 2 – Importing points representing major cities in Grasshopper
Step 3 – Importing Excel Datasheets with Ghowl
Step 4 – Generate new point heights from cost values in excel
Step 5 – Create mesh, datascape, from new points with a color gradient scheme
The high peaks and red colour stains show more expensive cities
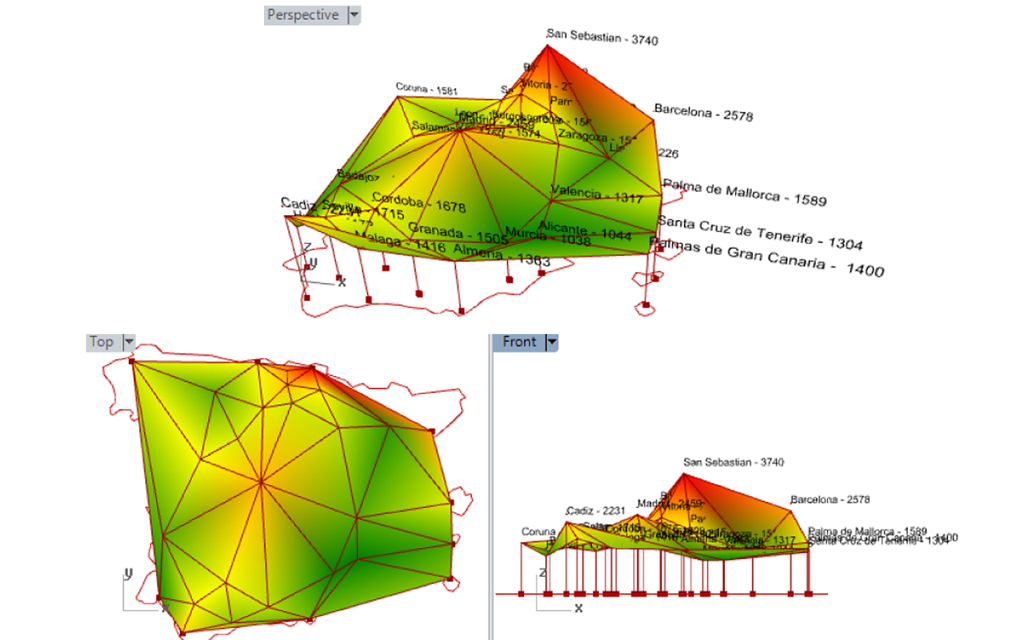
2. CONCLUSION
As expected, cost increases with proximity to the coast, France and Madrid.
In further study, it could be interesting to determine if the yellow spots connecting vertexes (cities) reflect road or infrastructure pathways.
Sources:
www.fomento.es
http://benfry.com/phd/