Everymorning we wake up and go to work or to school.
What is the average speed a person achieves during that route, and how is it affected by obstacles or distractions such as traffic or beautiful visions…
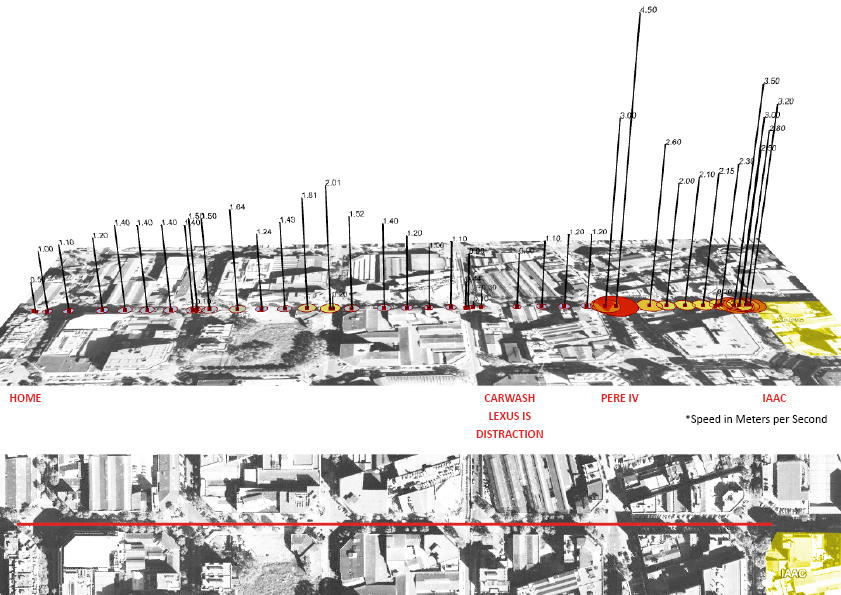
Data was obtained from myTrack app for Android on a smartphone. The app registered via gps the position and speed of the subject during the route from his house to IaaC University in Barcelona.
From the vizualizing results some conclusions were drawn:
Conclusion 1: At some zebra crossings the subject stops when the sign is red
Conclusion 2: At a local Carwash the subject reduces speed to look at a Lexus IS
Conclusion 3: At Pere IV he increases speed to cross the dangerous big avenue
Conclusion 4: Near Pujades the subject speeds up because he´s late
Vizualization Strategy and Tools:
1 – Get Ortophotomap from Google Earth with two referenced GPS points
2 – Import Map in Rhino and scale it to real size
3 – Draw points in Rhino on referenced points from map, and assign them in Grasshopper
4 – Assign referenced points in Grasshopper GPS coordinates and with Ghowl reference them to global GPS system
5 – Import in Grasshopper data file containing GPS tracked points and speed
6 – Arrange data file, sorting and listing position and speed items
7 – Assign circles and color meshes to each tracking point, the wider the circle and the redder the color,the bigger the speed
8 – Assign vertical line and 3dtext to indicate exact speed at each point