Category Archives: Pablo Miguel Marcet Pokorny

Earthquakes: Number of people affected and killed in relation to population density
Speculation
What is the relationship between the number of people killed or affected by earthquakes in comparison with the respective population density of worldwide countries?
Data Mining
The data we collected is composed of three branches:-
1. No. of people effected by earthquakes
http://www.emdat.be/database and http://www.cred.be/
link to data // https://spreadsheets.google.com/pub?key=rG_BjsDwyS2n7DANNH3i5vQ&gid=0
2. No. of people killed by earthquakes
http://www.emdat.be/database and http://www.cred.be/
link to data // https://spreadsheets.google.com/pub?key=rvbbs7uxQc7swJ4RR2BcQfA&gid=0
3. Population density per km squared
http://spreadsheets.google.com/pub?key=tVY51lNaCL9m9xPqf29oFAA&gid=0
Data Visualisation
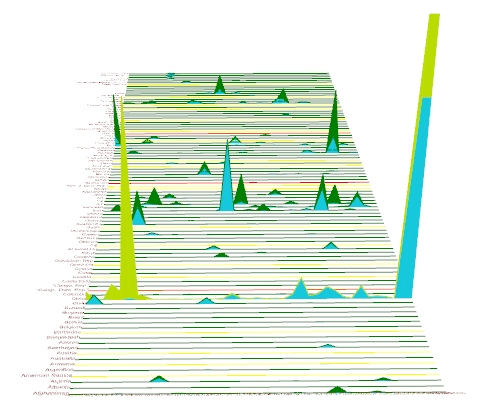
The data visualisation done through Grasshopper is a graphical representation that creates a comparison between the number of people effected by earthquakes and the number of people killed by earthquakes on a yearly basis. The population density is also taken into account in order to understand better if this relates to the number of people effected/killed.
The number of people effected, number of people killed and population density are represented with green, blue and yellow respectively. The bottom part of graph is the number of affected people whilst the top is the number of killed people.
This kind of graphical representation can be used further for our design studio to see differences between population densities and other social factors happening at the same time.
Also posted in Uncategorized Comments closed