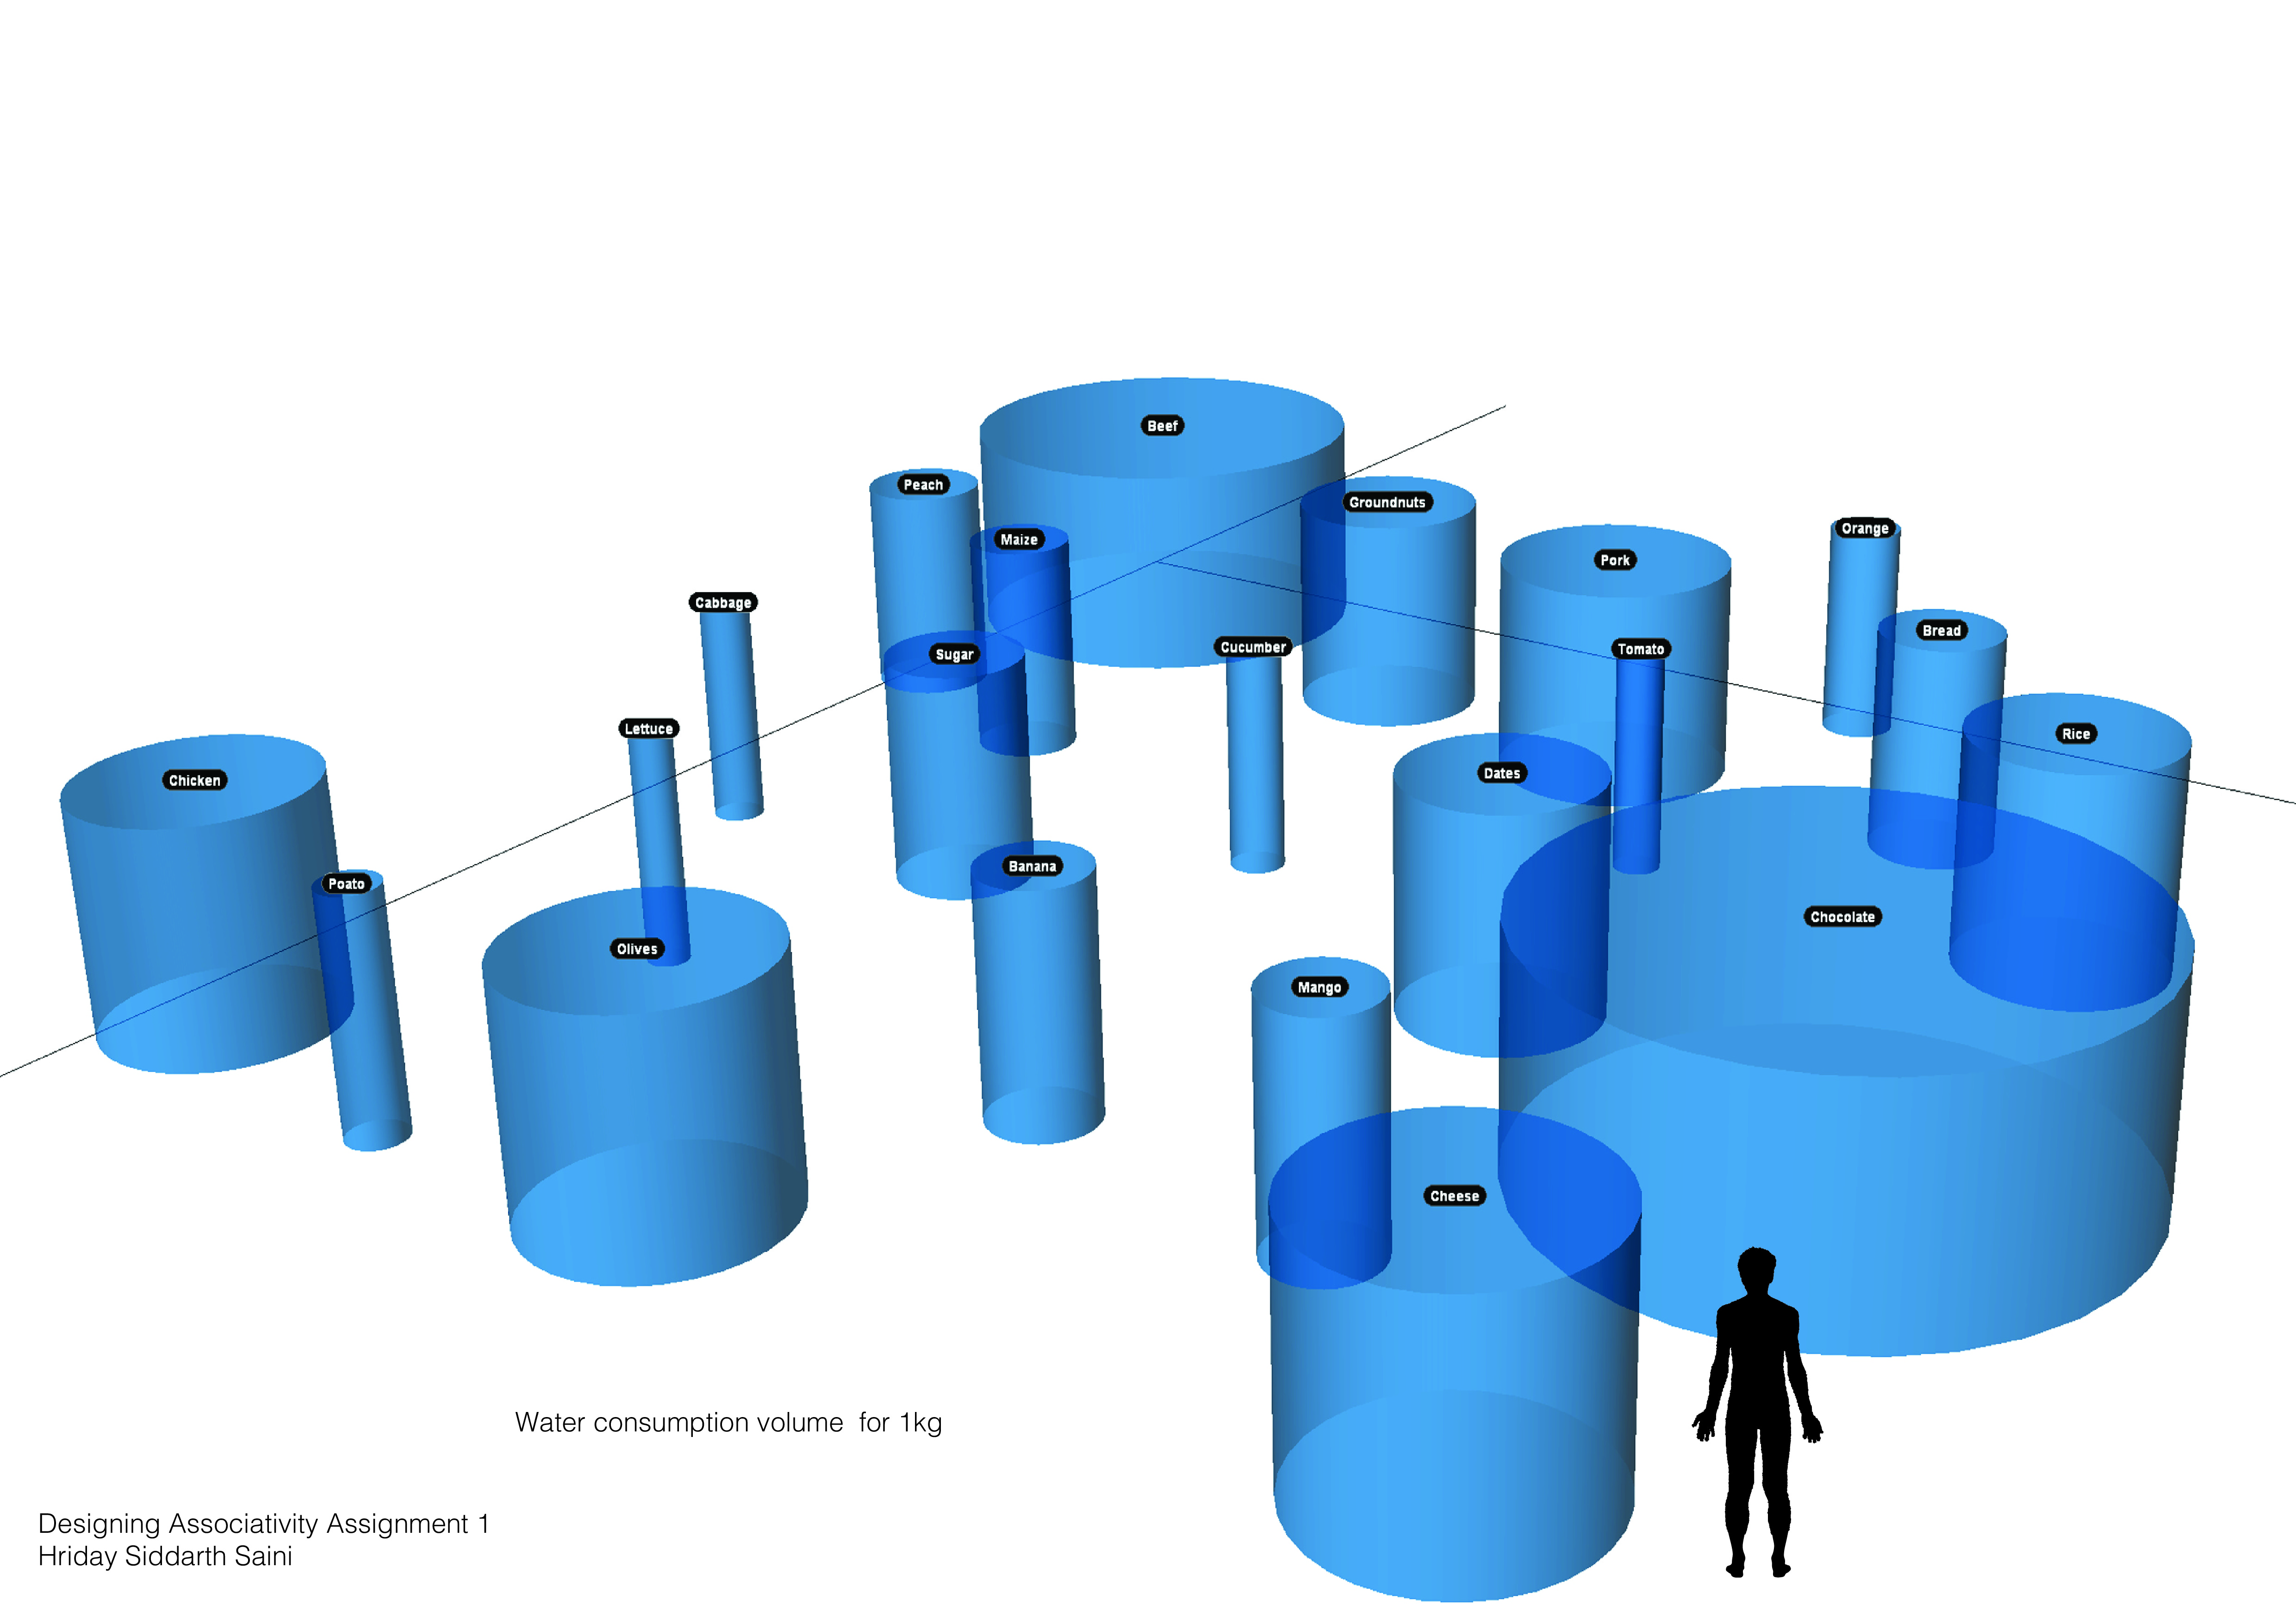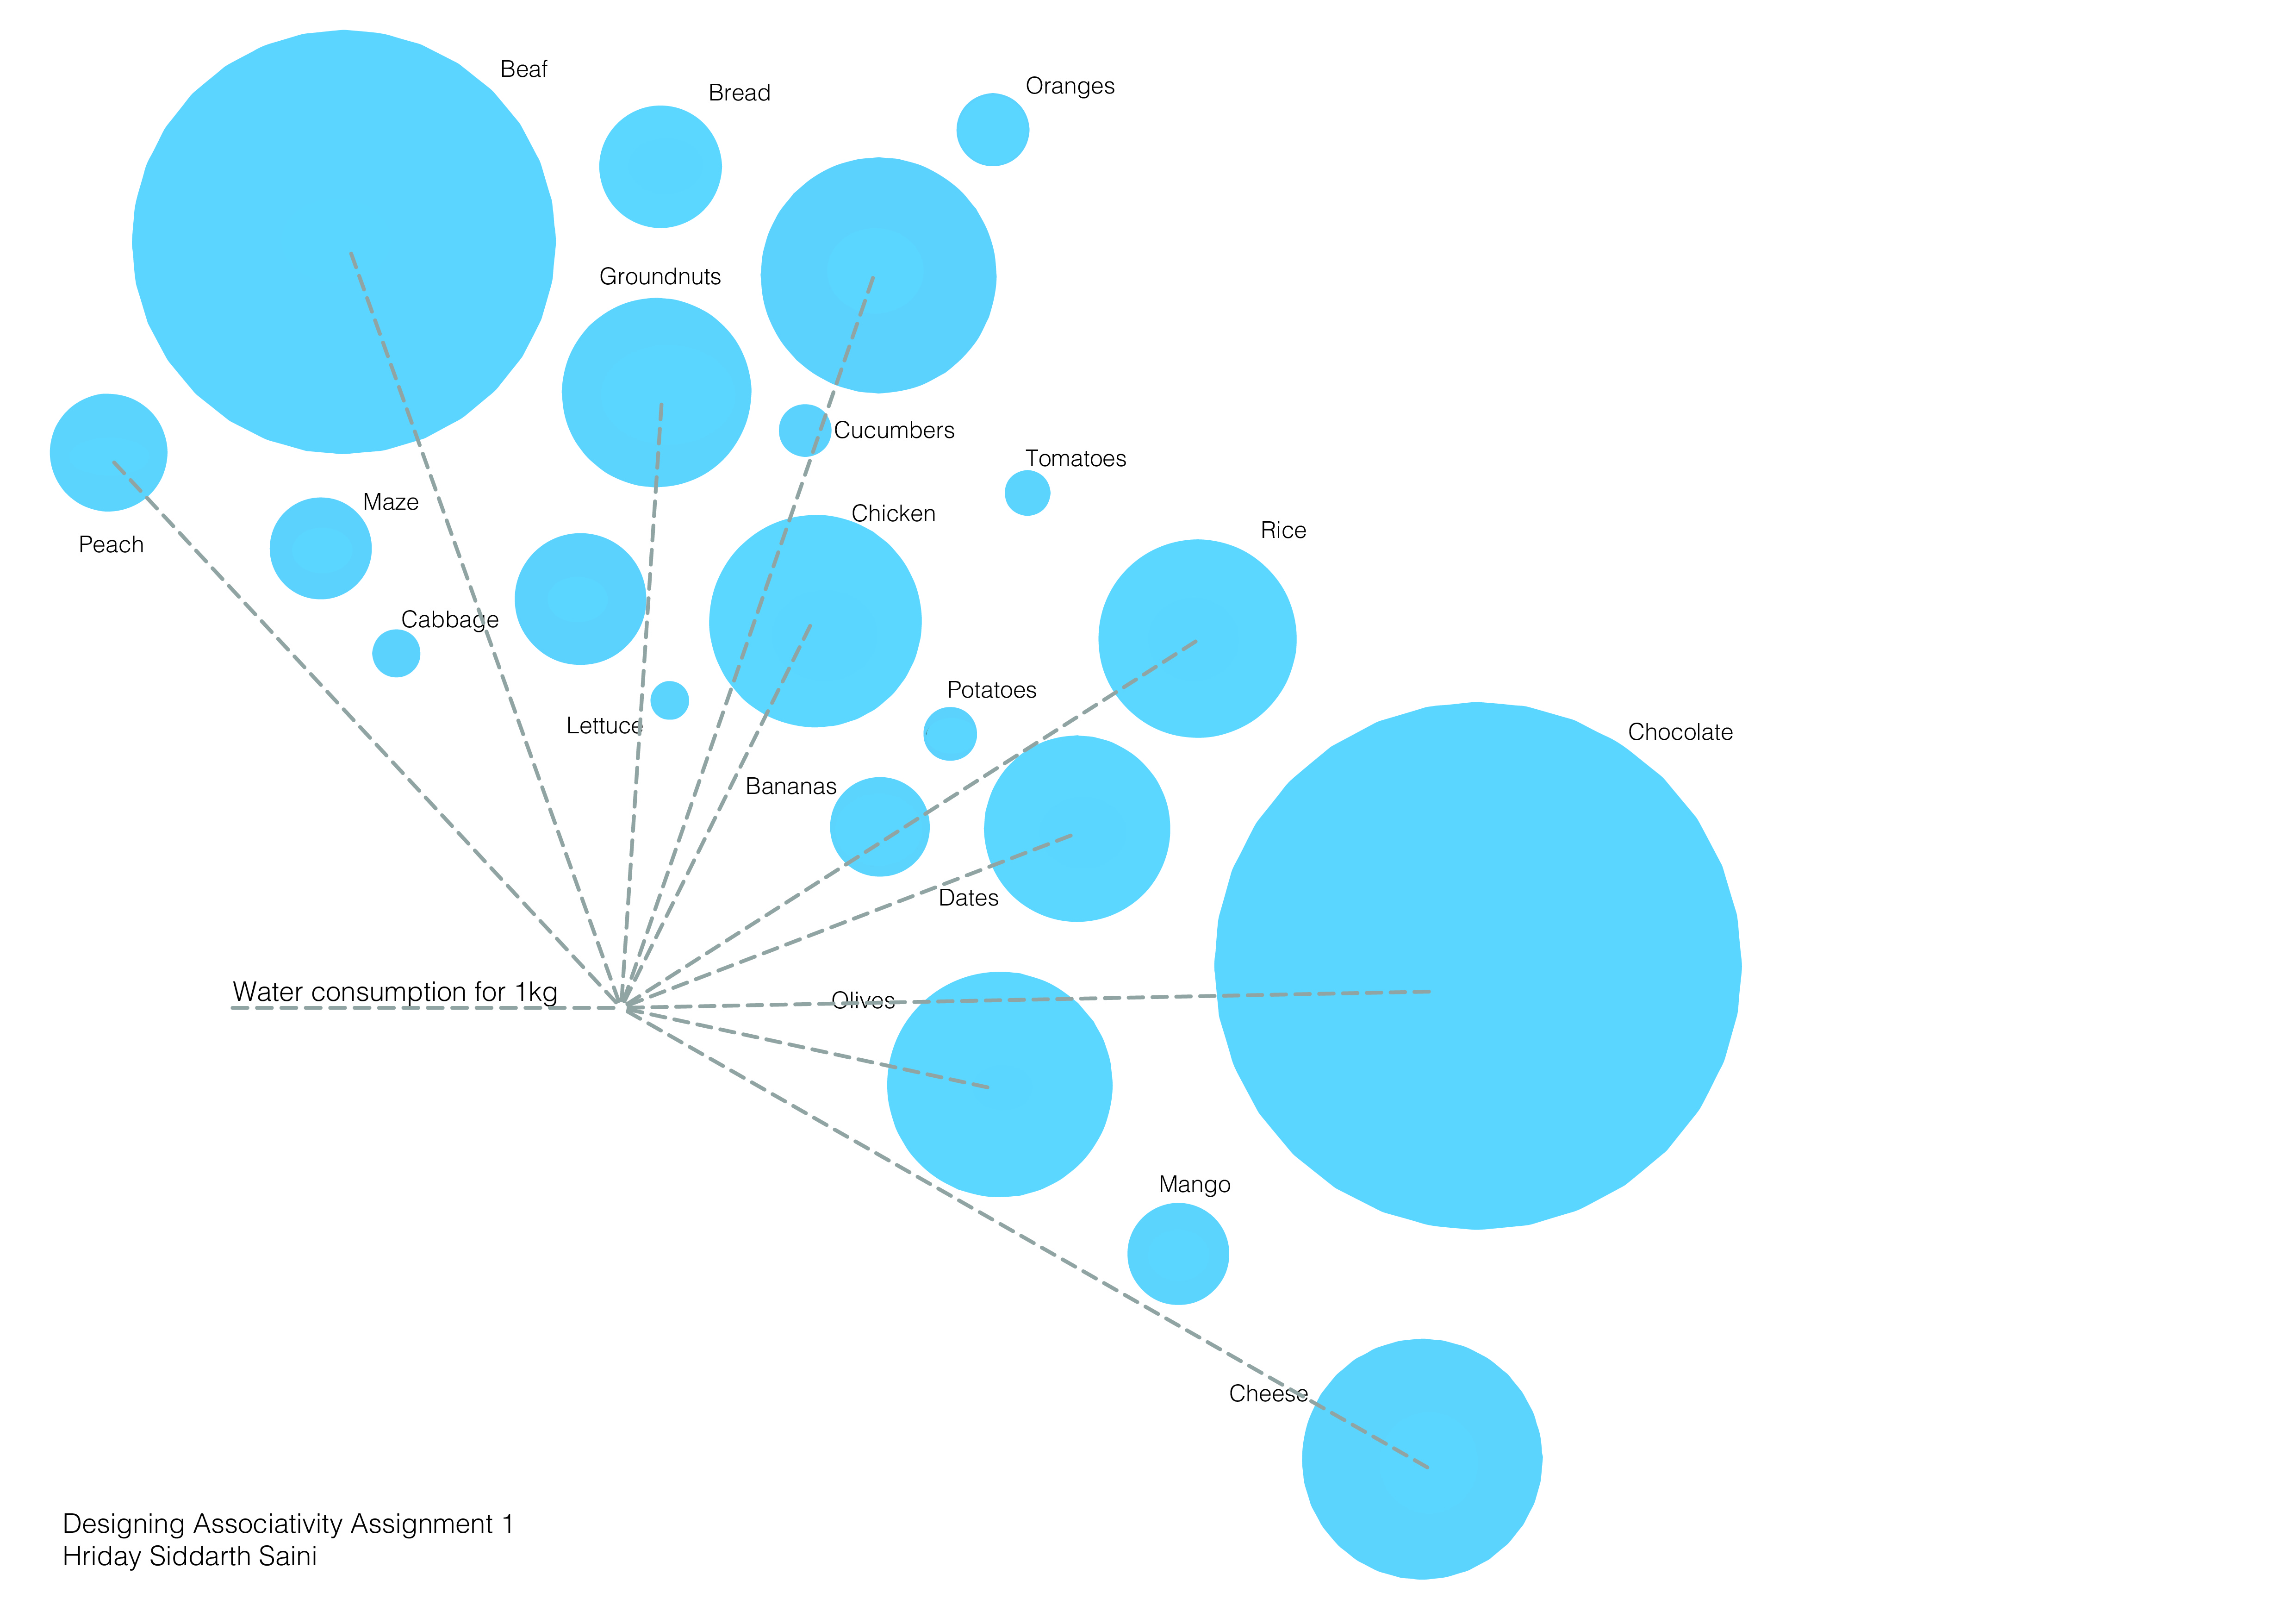
The data maps the water required for production of 1 kilo of the specified food items. The circles represent the volume of water spent in the manufacture of the food items. The attempt was to map the volumes in proportion to the human volume to get an idea of the scale.