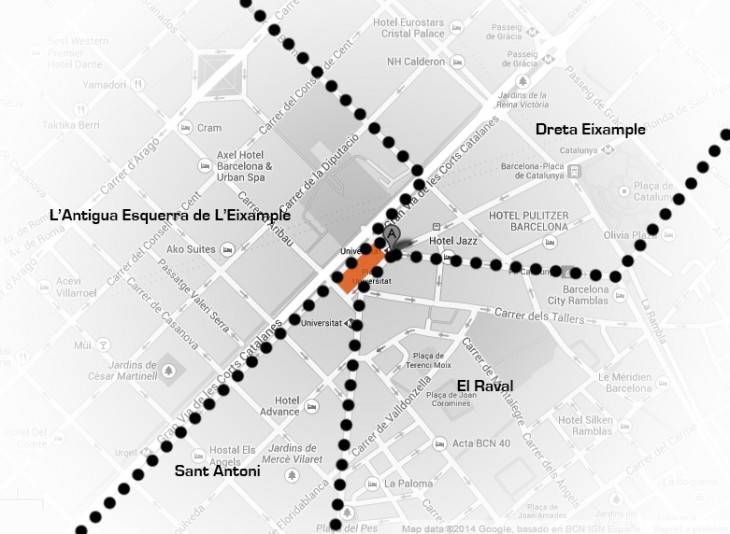
Placa Universitat is the context I am studying for an interactive installation. I am interested to know what is the age population for the area around the site, in order to target users from specific age groups and know what are the proportions of each age group in relation to one another. I have reduced the list from the initial data to the surrounding districts which are L’Eixample and Ciutat Vella.
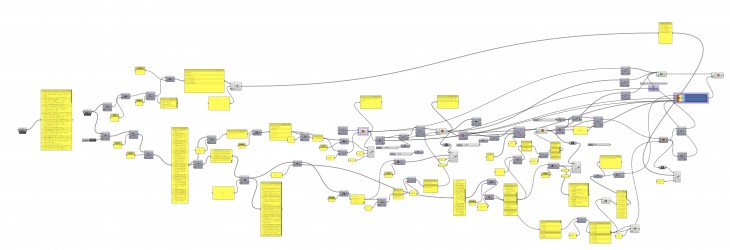
Other than reducing the list, I have also added the total population for each concerned districts as well as for Barcelona as whole. My aim was to obtain a hierarchy of numbers in relation to the area, starting from Barcelona and zooming in to the neighborhoods around Placa Universitat. The Data were obtained on the website of Barcelona’s city hall open data service.
The final result shows in a circle type chart the number of population from Barcelona to the districts and then the neighborhoods, but also, the different age groups proportions by neighborhoods. The only dominating group in the showing districts in general is the 25 to 65 years old group. While we notice that in Eixample proportionally the age group of 65 and more is bigger than in Ciutat Vella.


