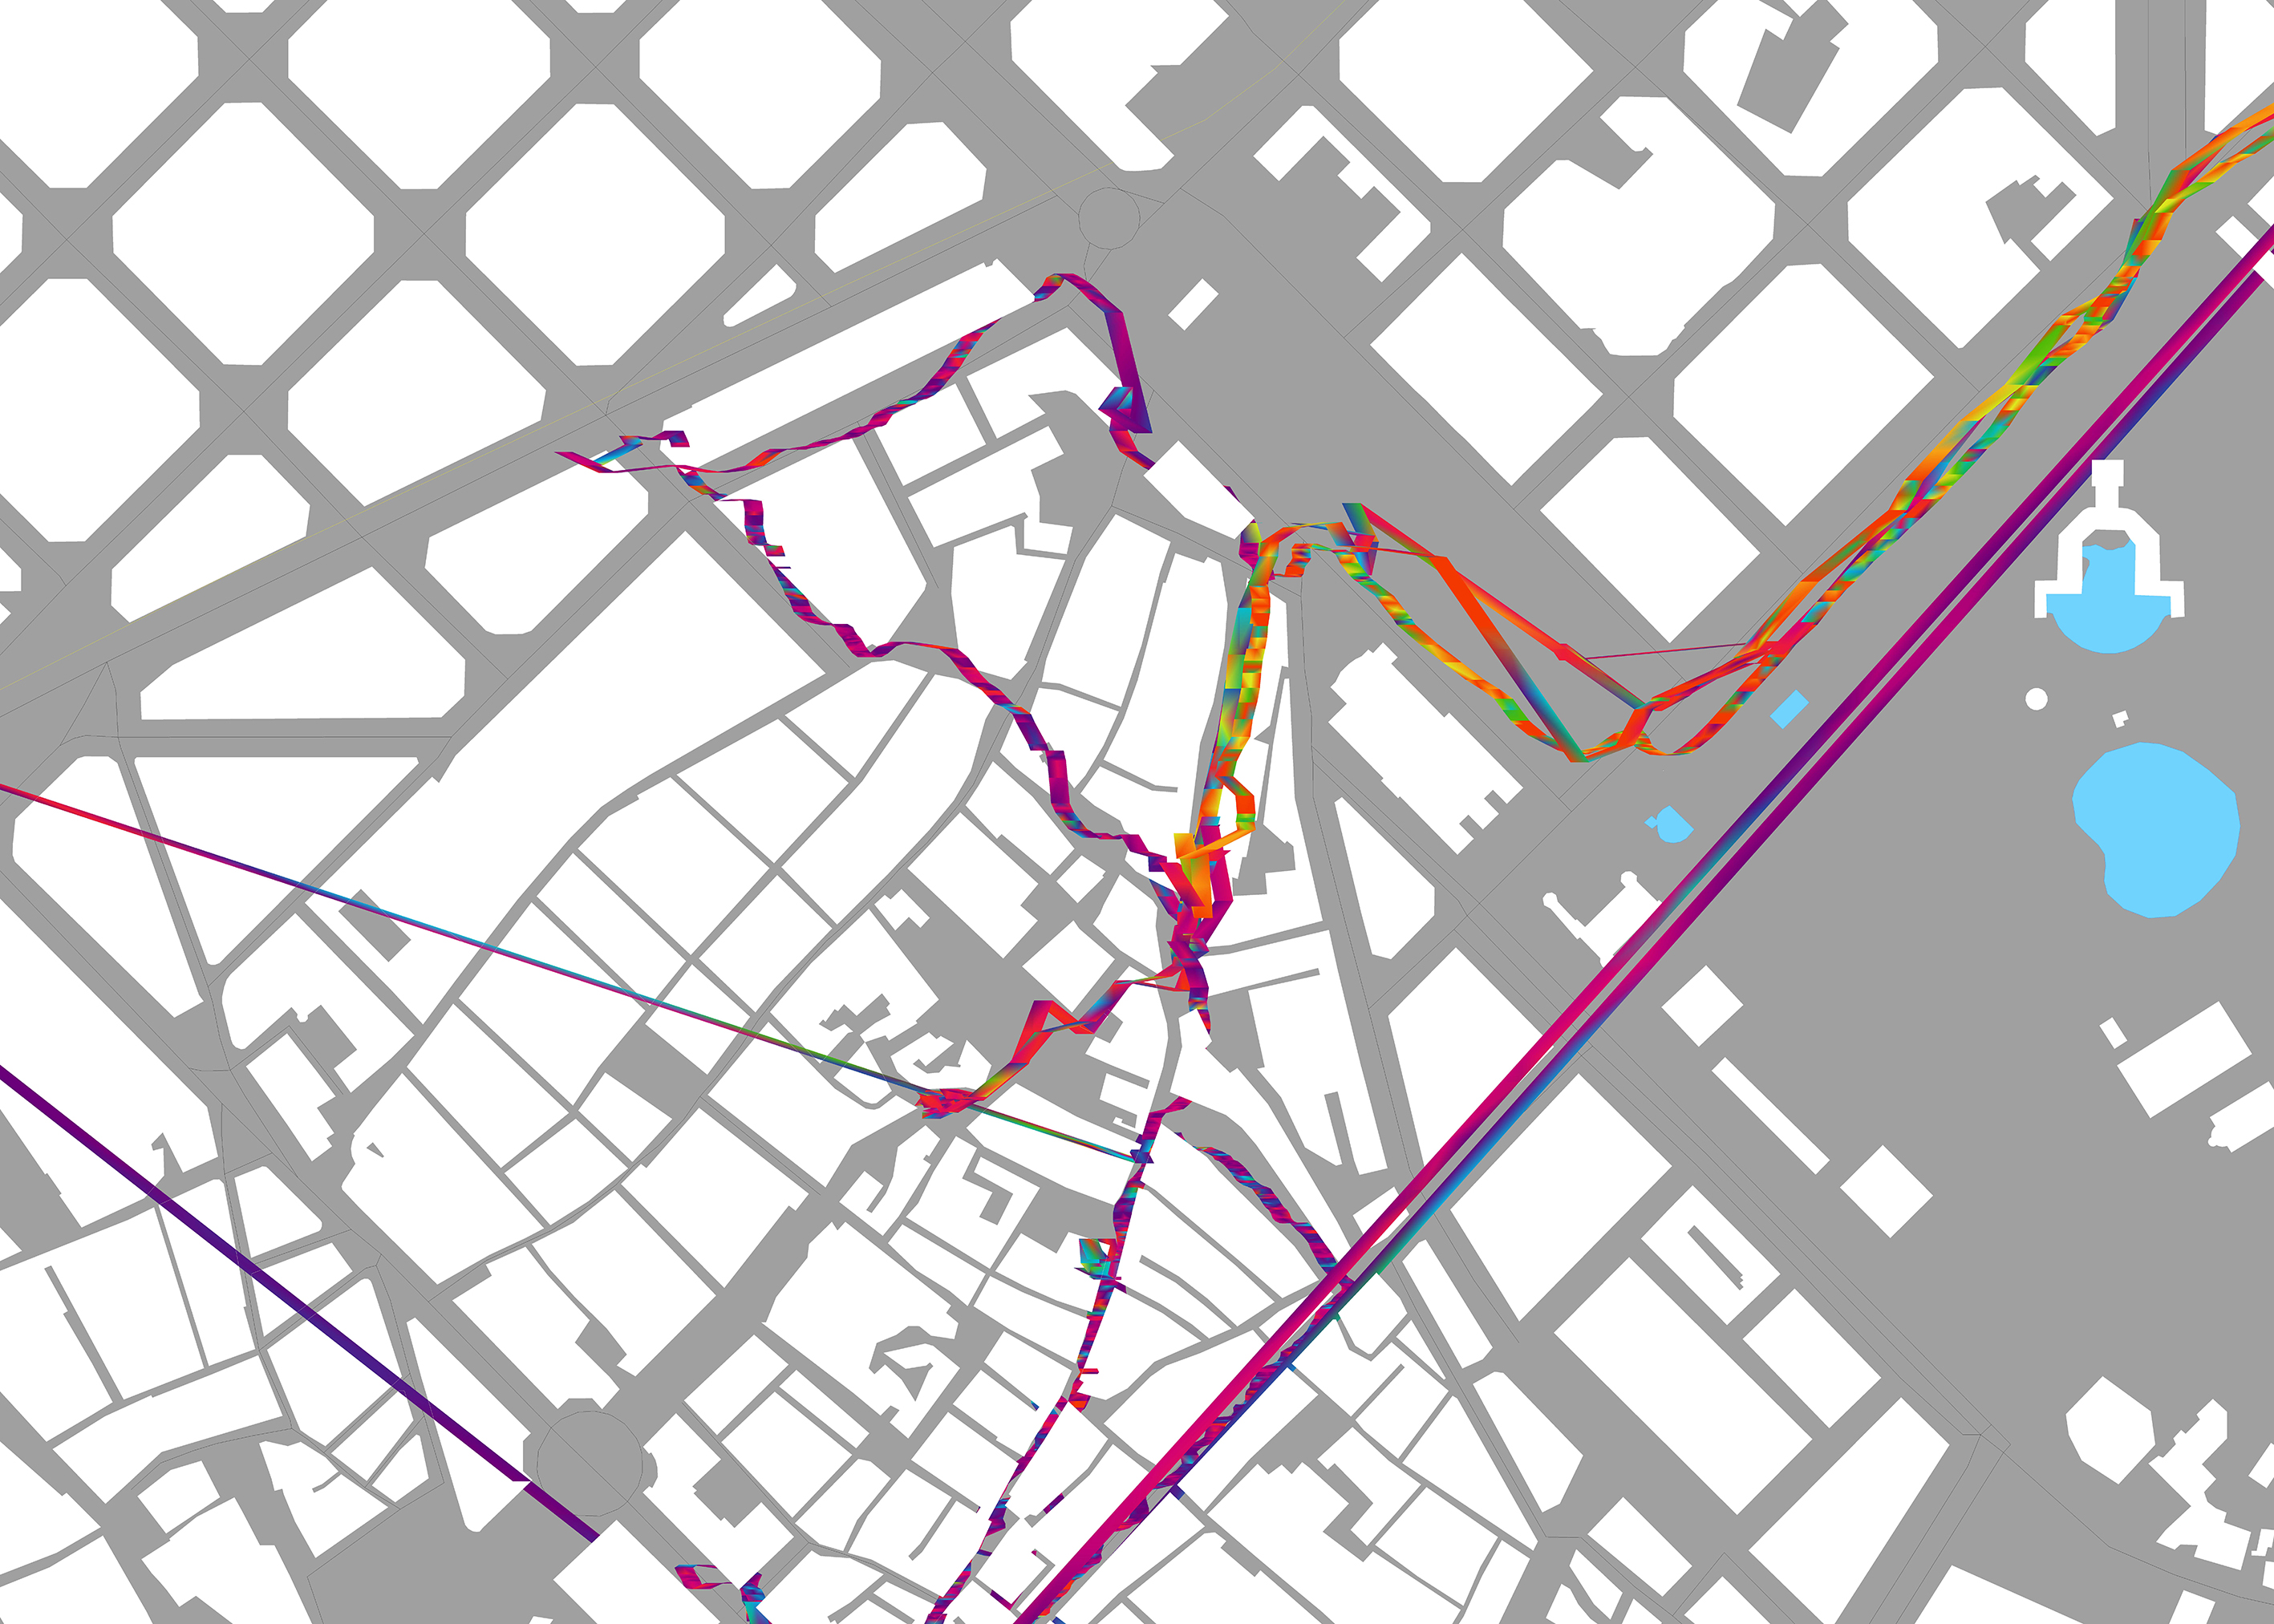
I tracked myself using the iphone application GPS Kit Free, which along with the map, sped and altitude diagram, also stores the data in a kml and a gpx files. Based on the data, I wanted to show the corrolation between the altitude (which could suggest the nature of transportation; underground being for the metro), and the speed. I used the OSM data to reproduce the area of Barcelona that appeared on my tracking maps. I gave a thickness to the tracks lines so they could be readable in plan as well as in top view.
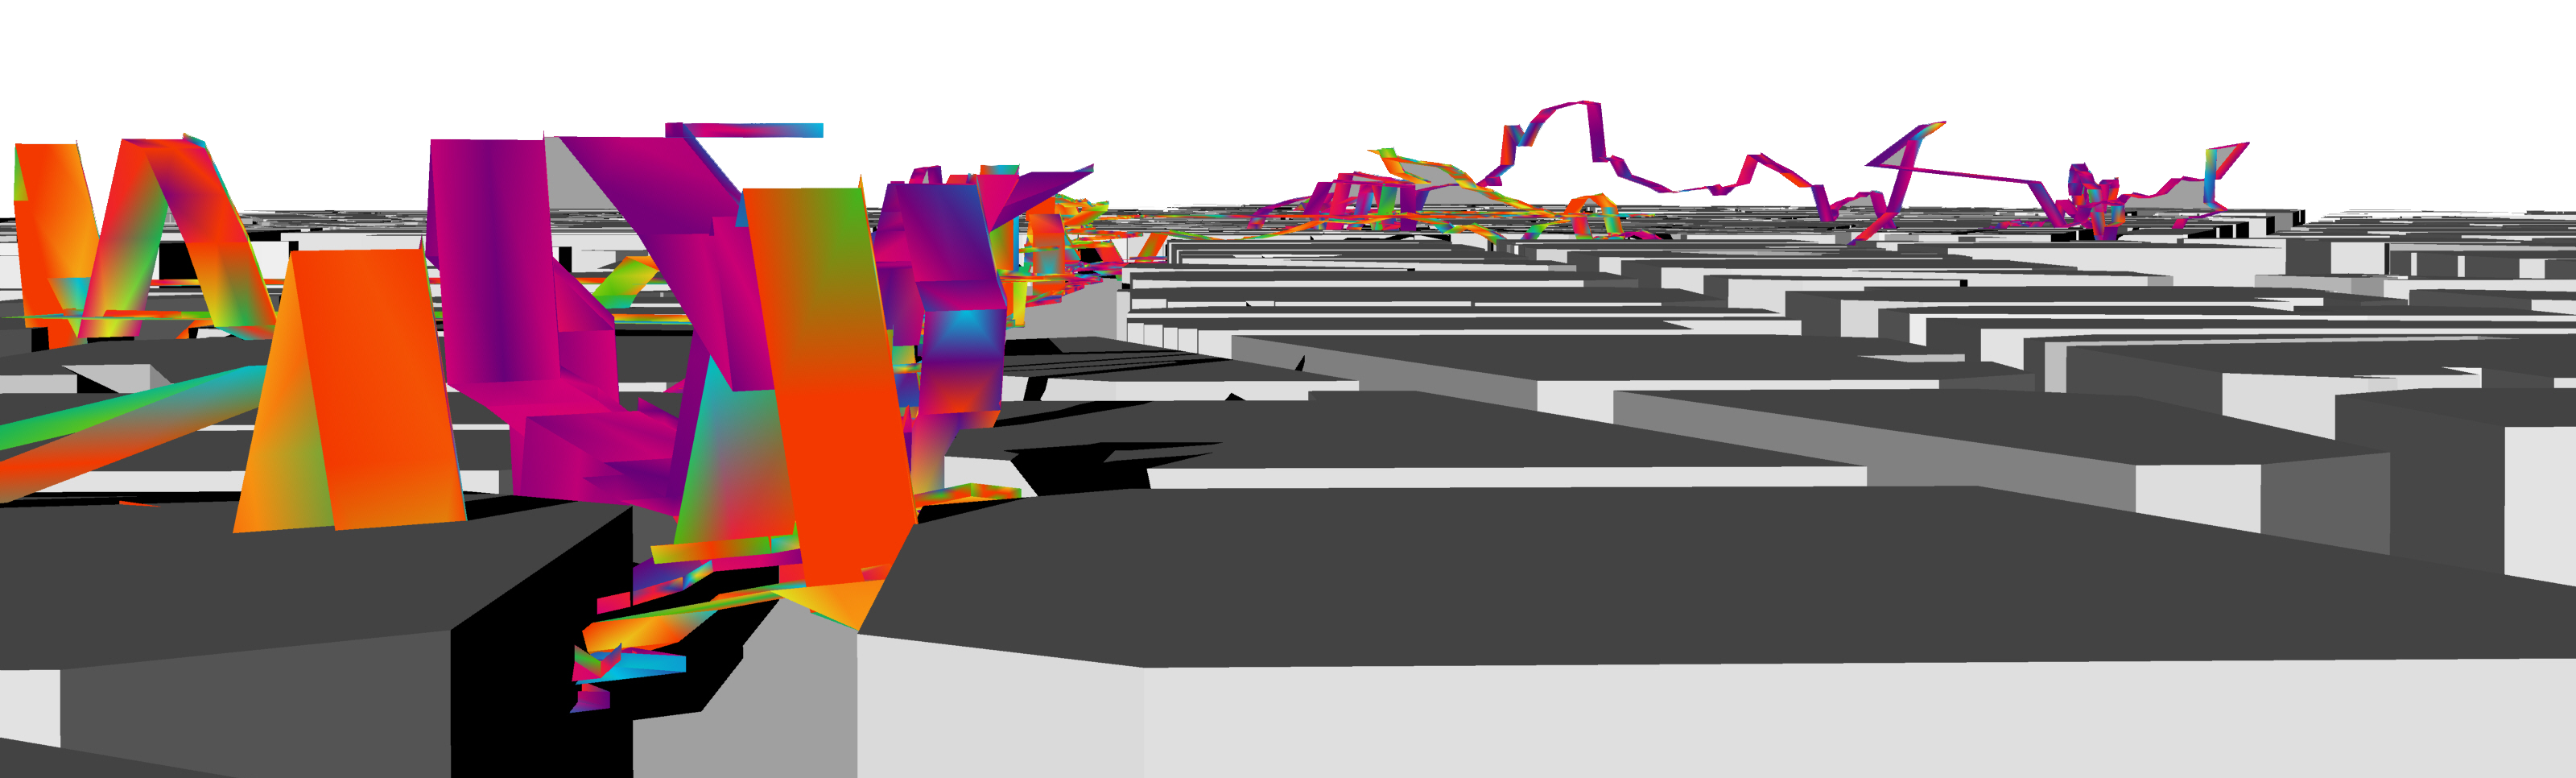
perspective view
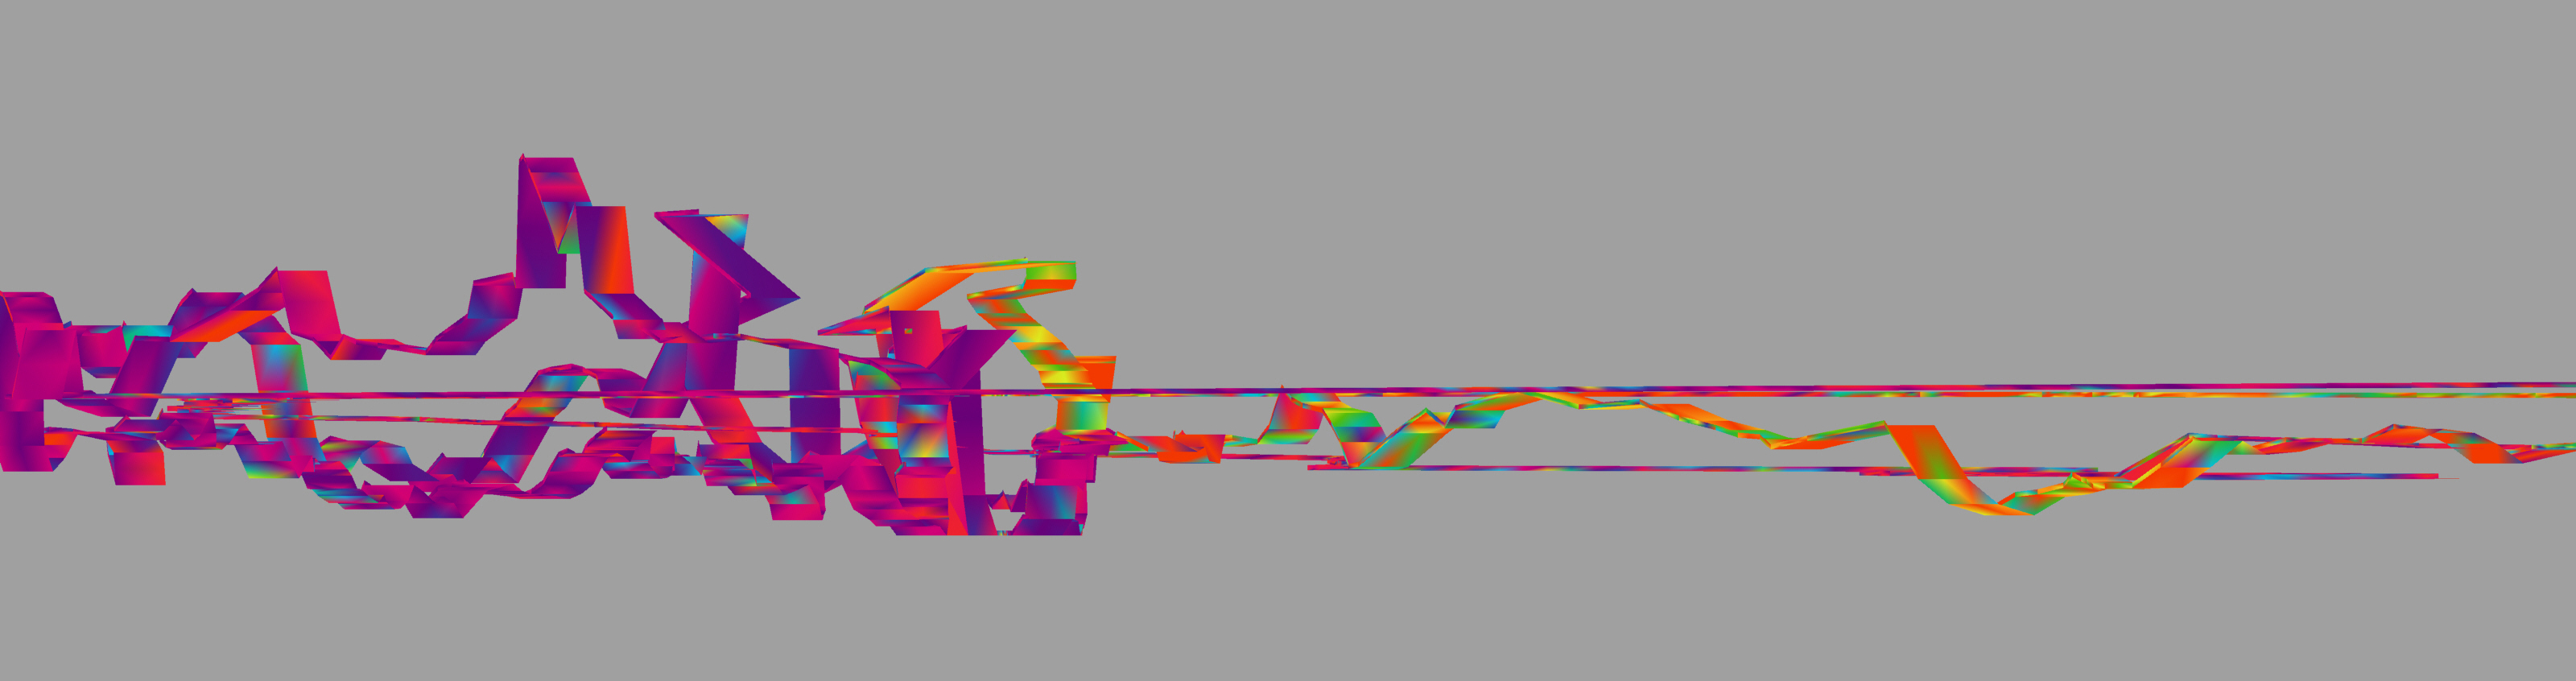
side view of the tracks
OSM data
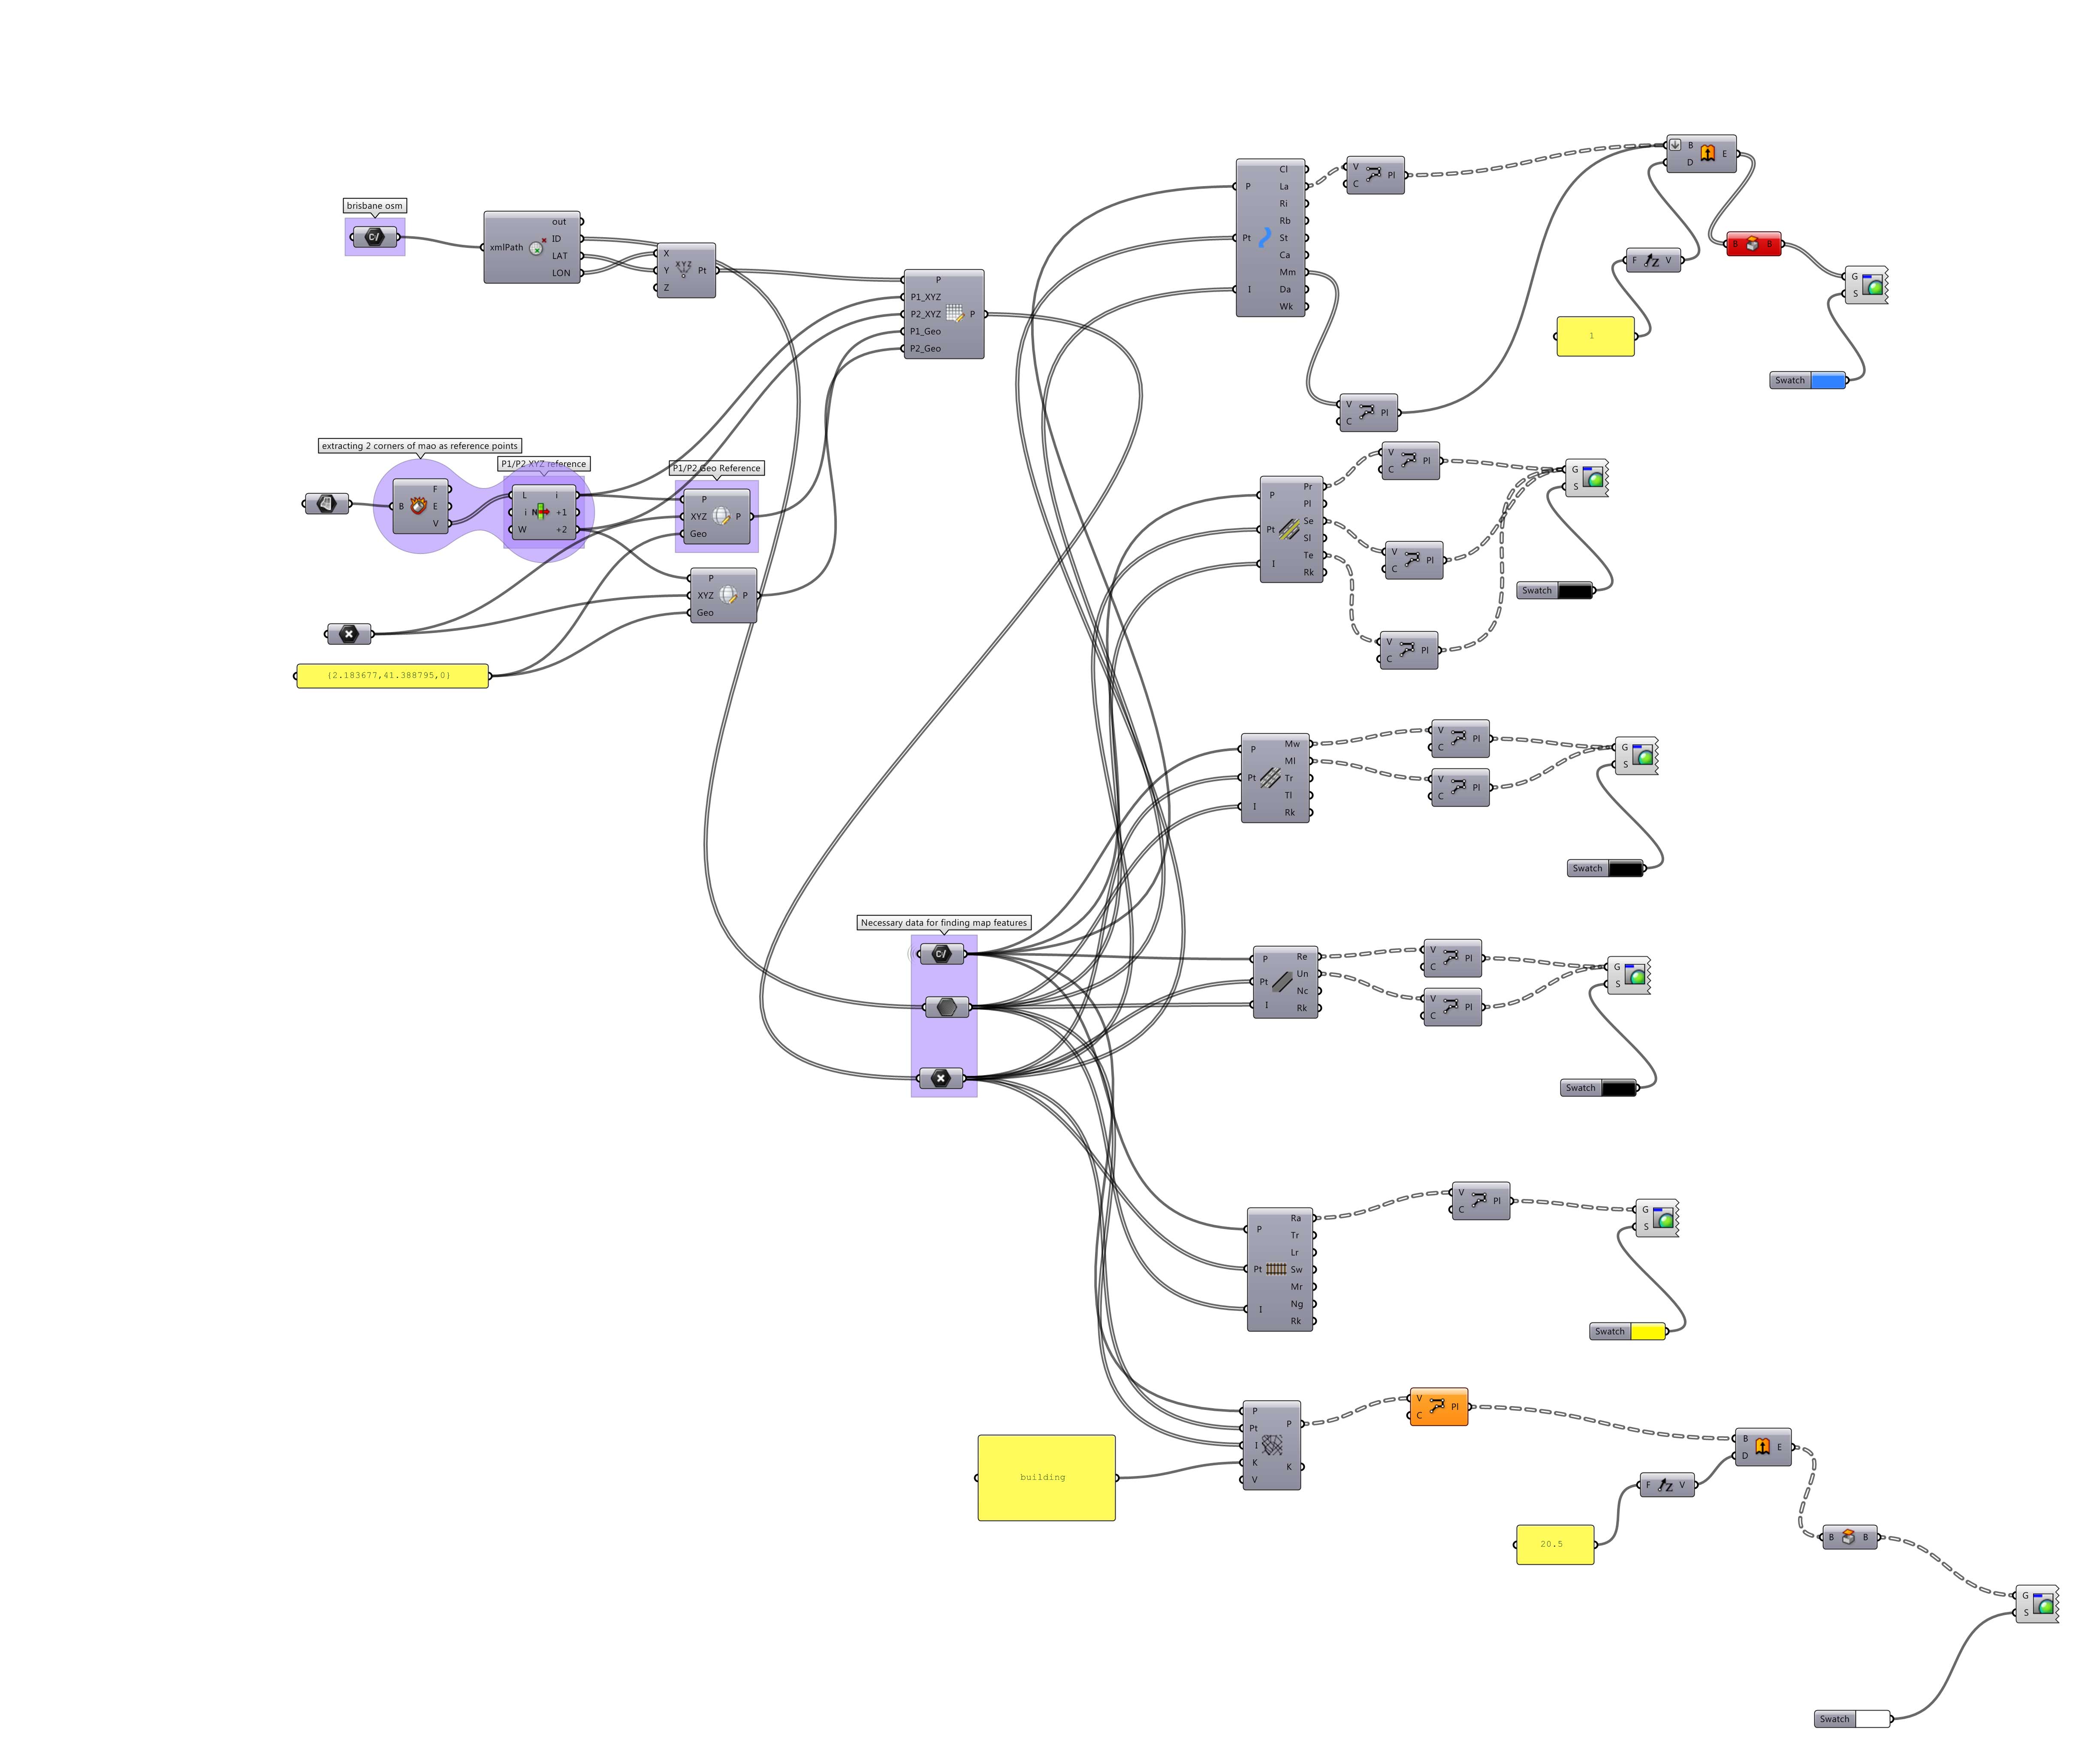
grasshopper definition assigning color to speed and height to elevation points