Analysis of Waste produced at SANT ADRIA DE BESOS
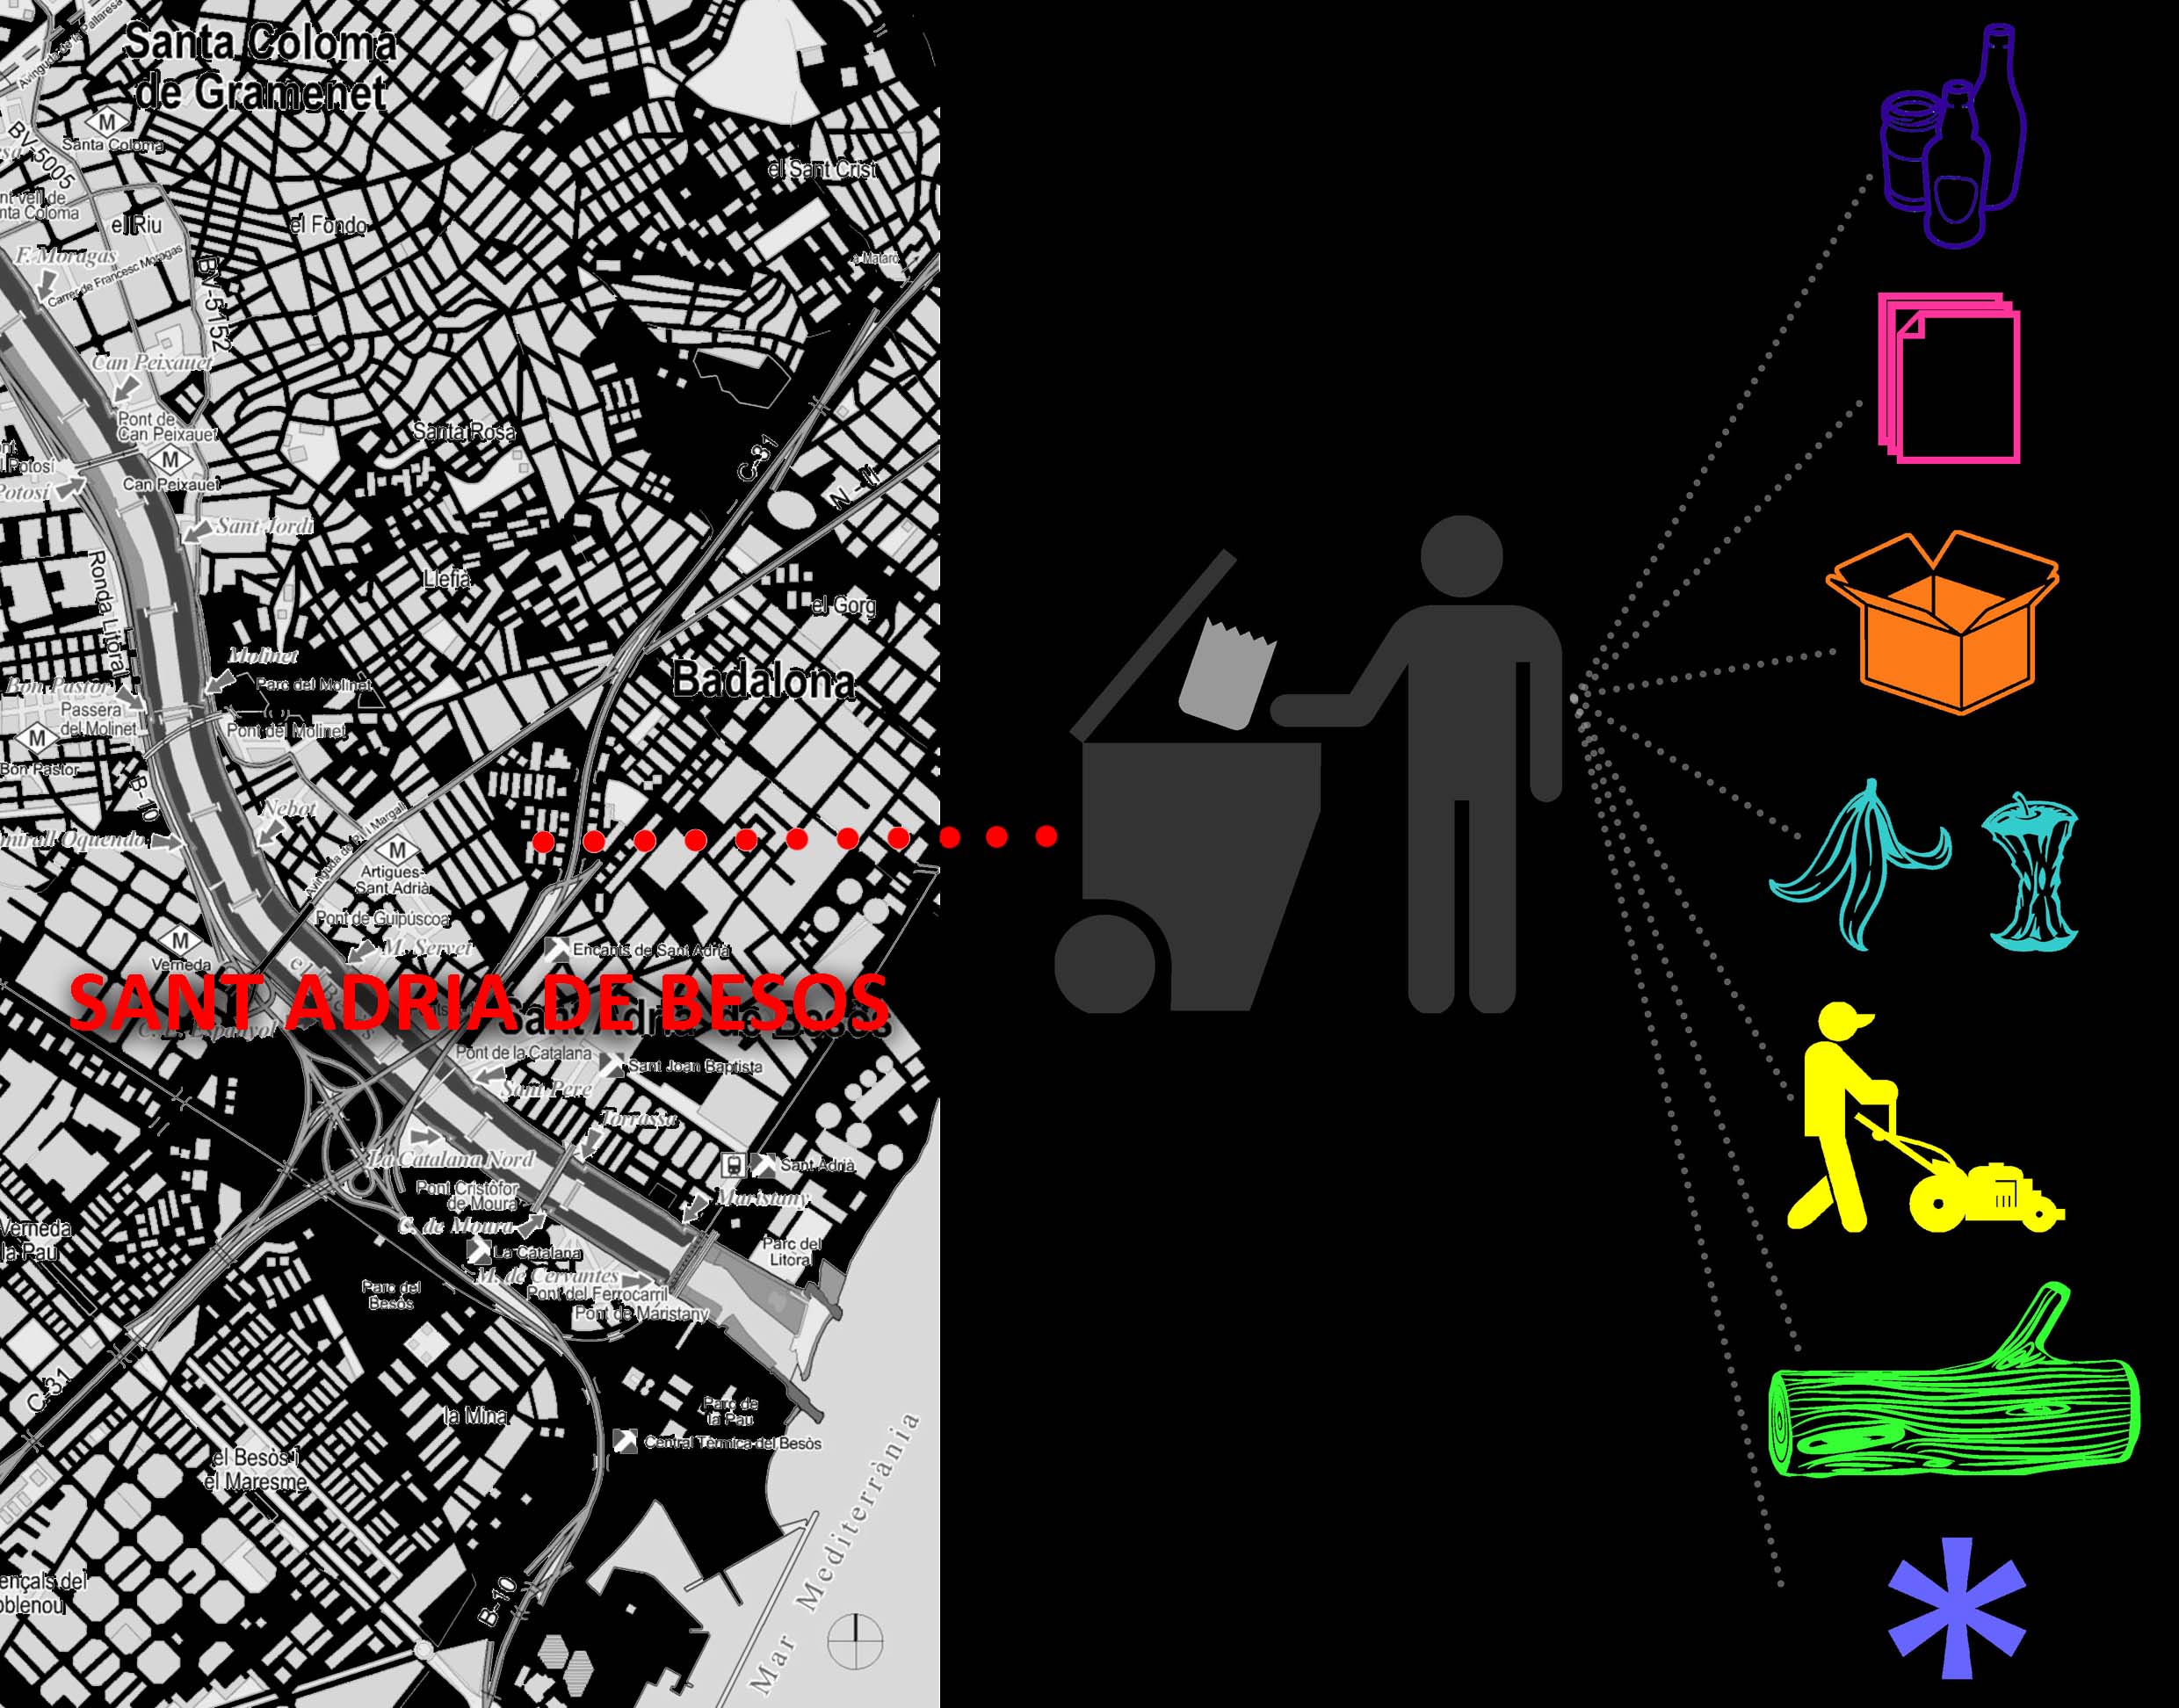
Sant Adria De Besos, is a municipality within Barcelona. It is situated at the mouth of river Besos. This area is the focus in our Design Studio [Emergent Territories]. For decades, this section of the Besós was one of the most polluted river areas in Catalonia. but a wastewater treatment system installed in the 1990s has improved its condition. Hence the data focused on, is the amount of waste produced in Sant Adria De Besos, Barcelona. The objective is to study the different kinds of waste produced in this area over a period of time and what are items that have been varying or increasing/decreasing.
Data Collection
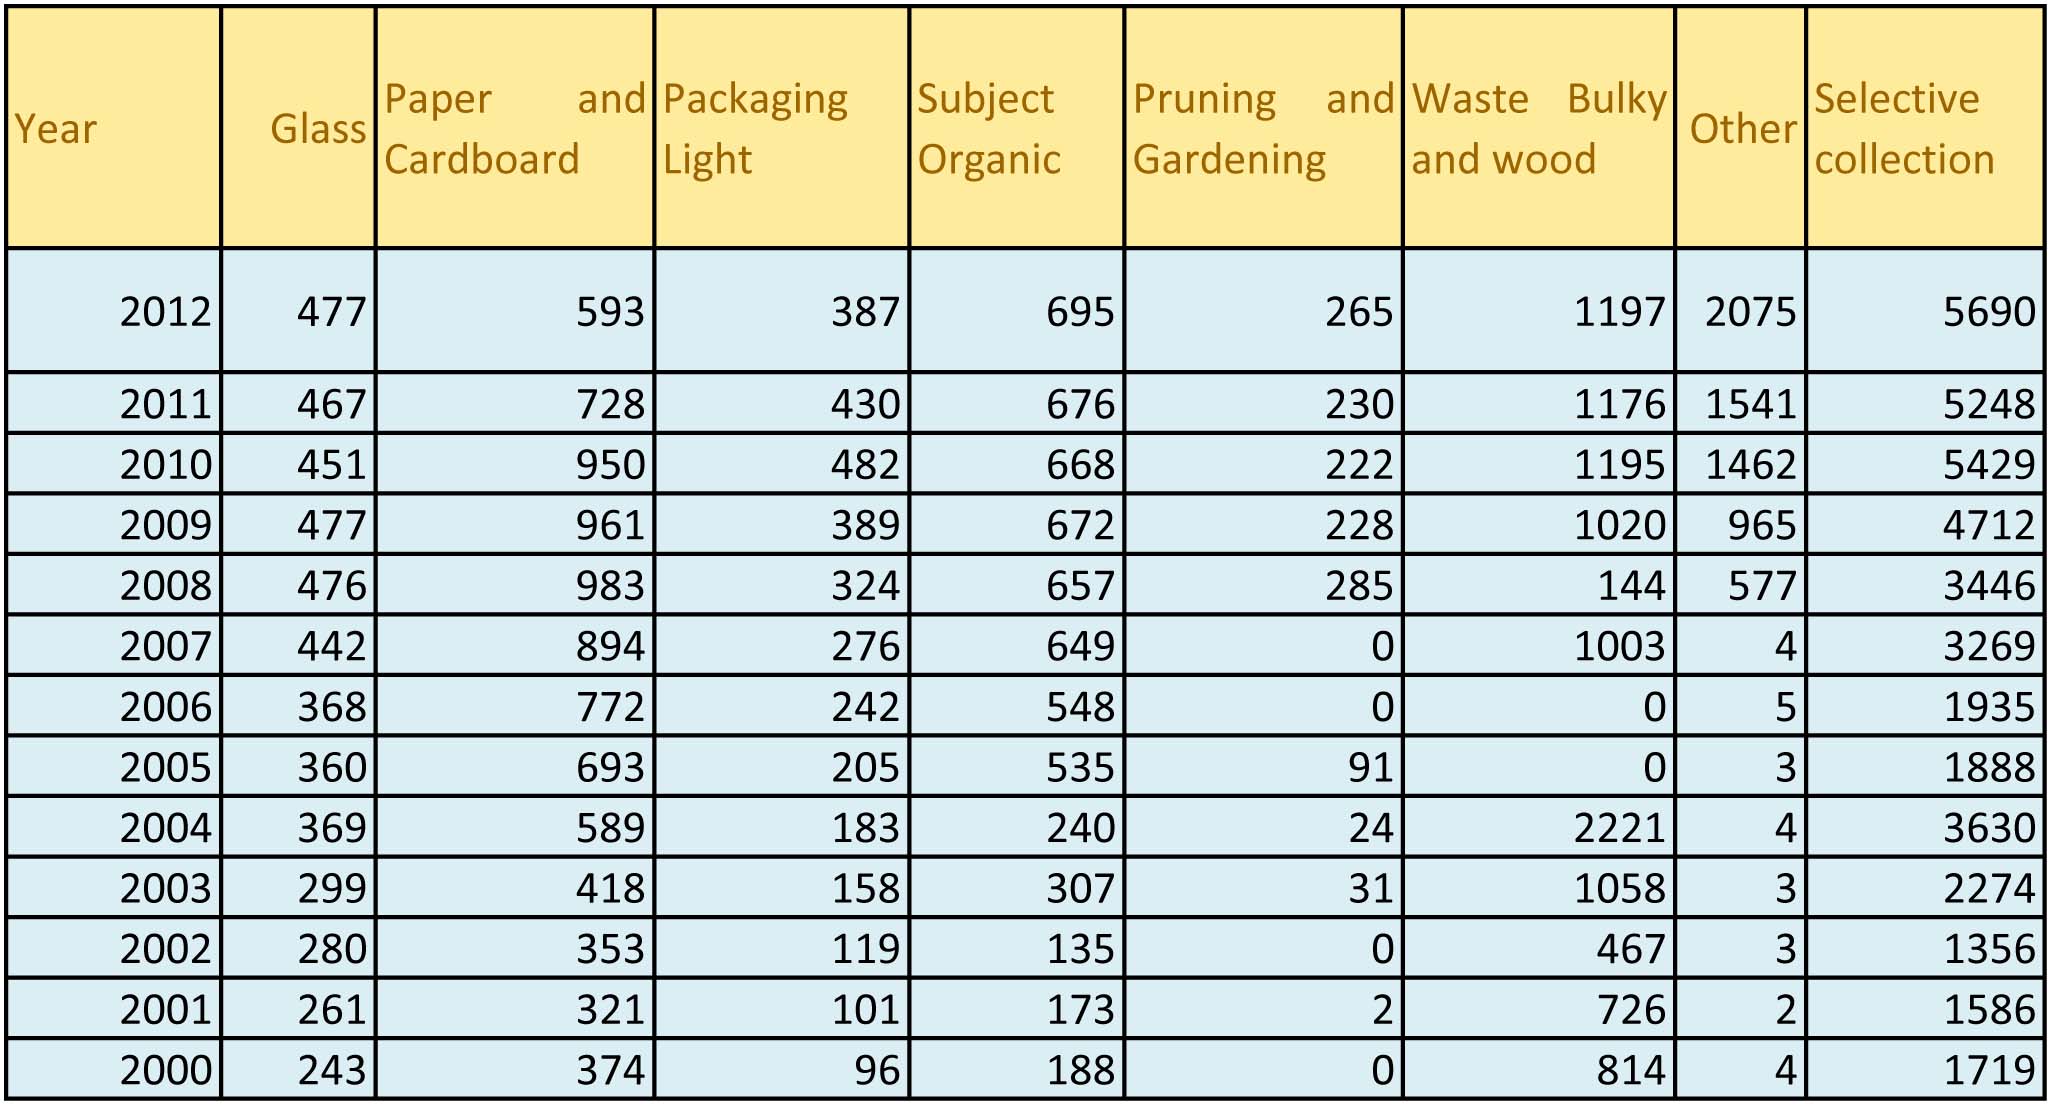
Source:http://www.idescat.cat/
The above data is collected from www.idescat.cat and converted to csv file to be imported in Grasshopper.
The resulting visualization consists of the 7 Categories of waste produced in a single bar. The bars represent the years and are divided according to the value of the 7 categories respectively.
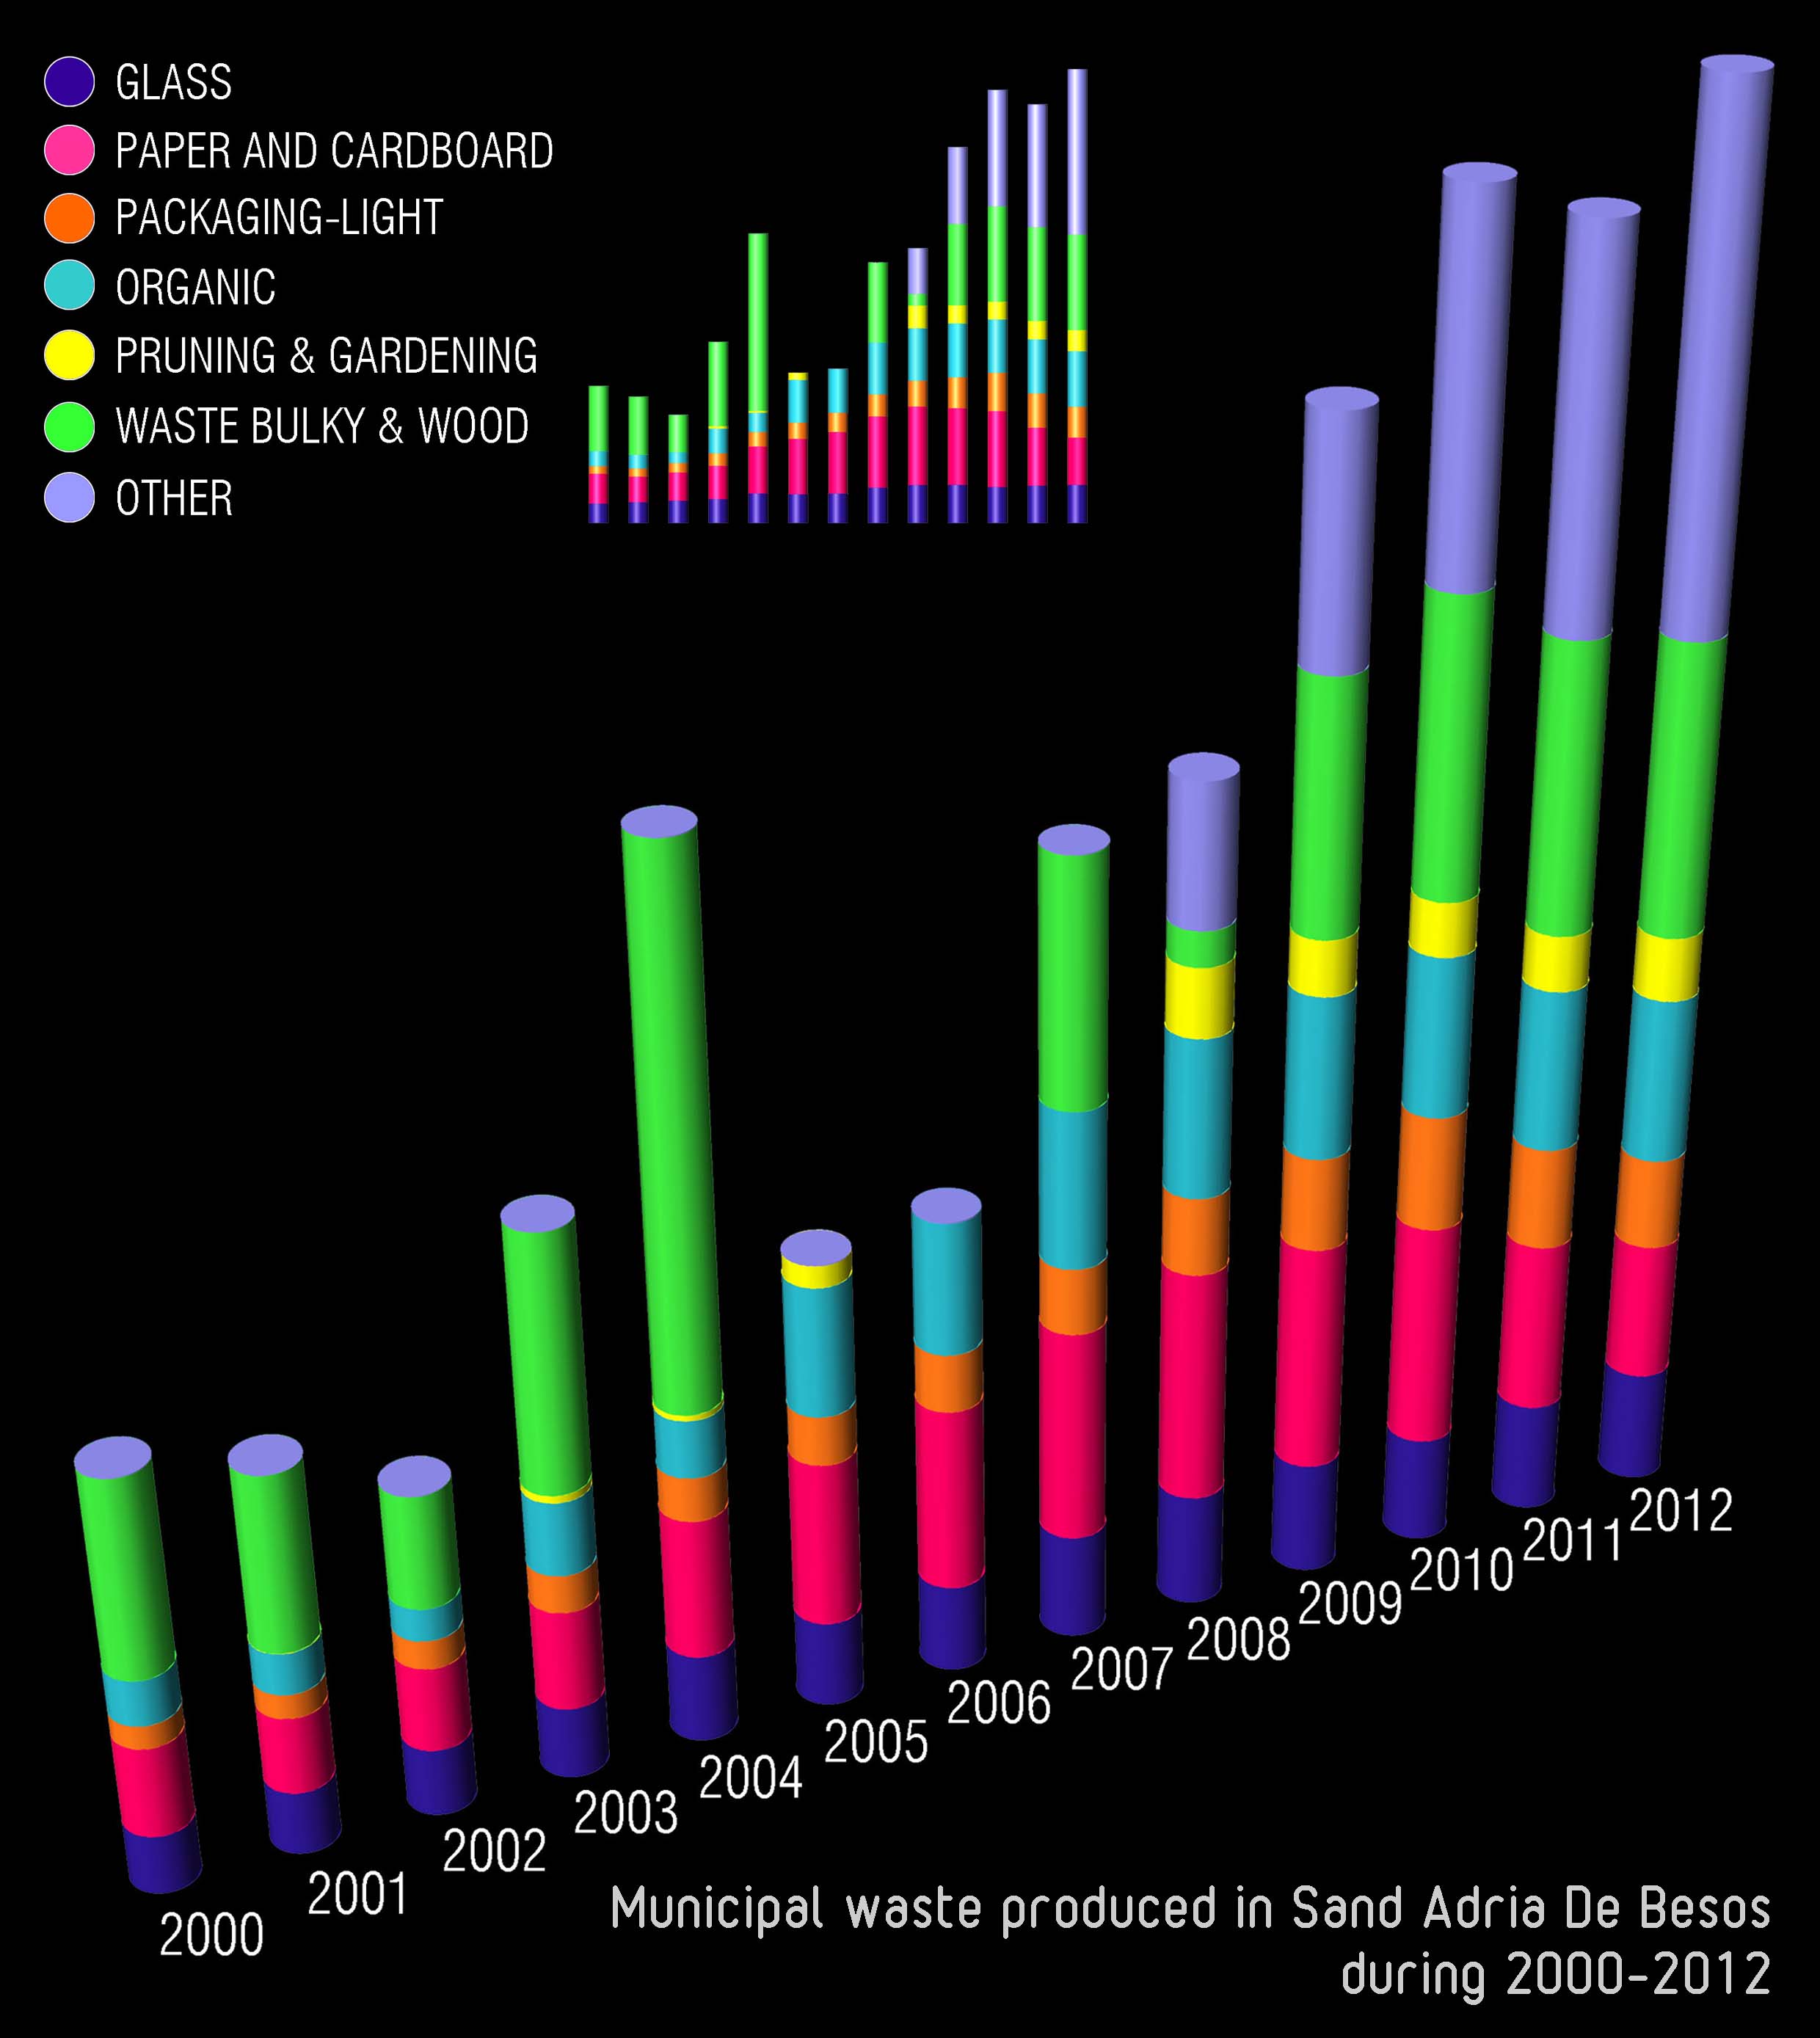
The graph indicates drastic decrease in wood waste during 2005-2006 after a high in 2004.
Another noticeable change is – paper and cardboard waste been decreasing since 2010.