Ref :http://cdn.c.photoshelter.com/img-get/I0000bGwBzgosEk4/s/750/750/exit-immigration-spain012.jpg
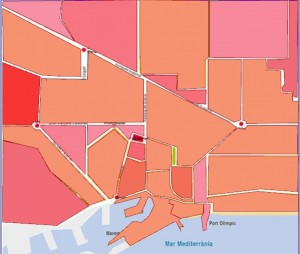
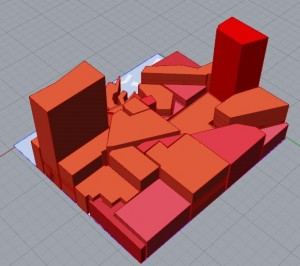
Immigrants in any place have a positive as well as negative effect on their host country and its economy. Here is a study of number of immigrants per district in Barcelona city.
THE VISUALISATION ABOVE SHOWS THE STUDY OF IMMIGRANT POPULATION IN THE CITY OF
BARCELONA BY DISTRICT
THIS VISUALIZATION HELPS TO UNDERSTAND THE DENSITIES OF IMMIGRANT POPULATION IN
VARIOUS DISTRICTS OF BARCELONA.
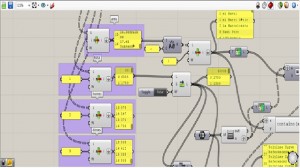
Process:
1. SEPARATING A SET OF DATA INTO DIFFERENT LISTS AND CLEANING THEM.
2.CALLING/RETREIVING EACH FIELD DATA AND REMOVING TEXT ENRTY FROM THE DATA TO BE REPRESENTED.
3.SETTING BOUNDS AND REMAPING VALUES TO REPRESENT DATA. SETTING CURVES FOR EXTUSION AND CHECKING FOR A MATCH.


