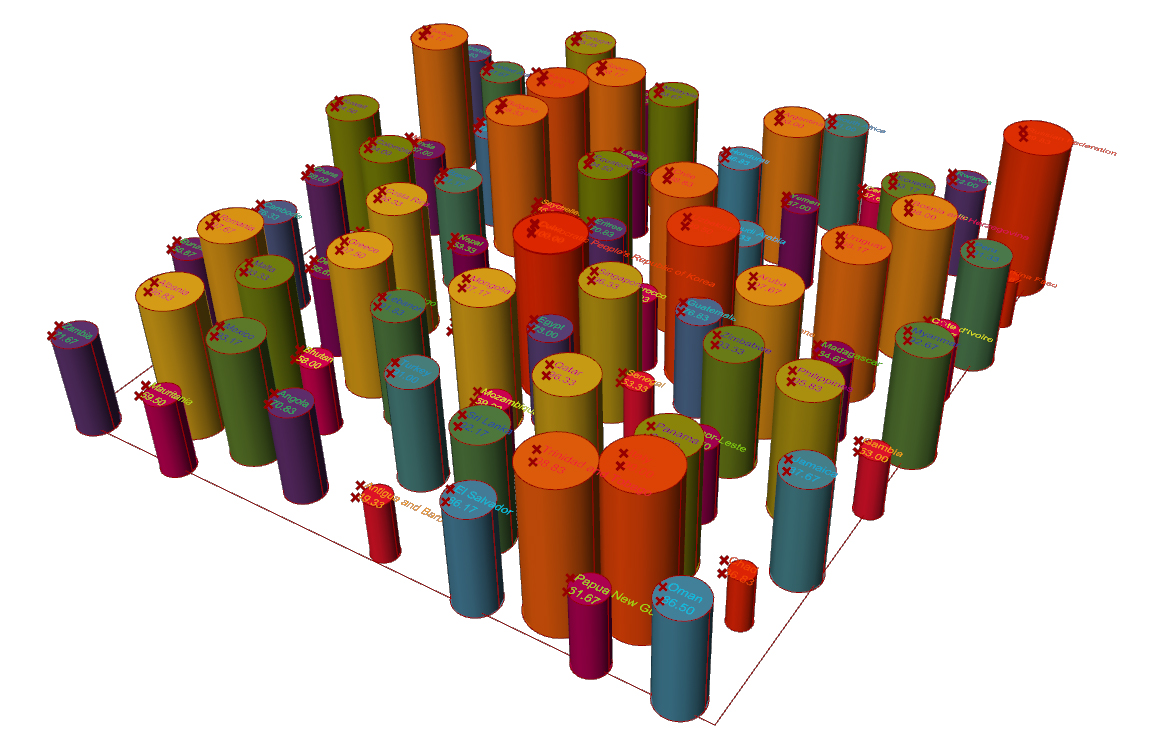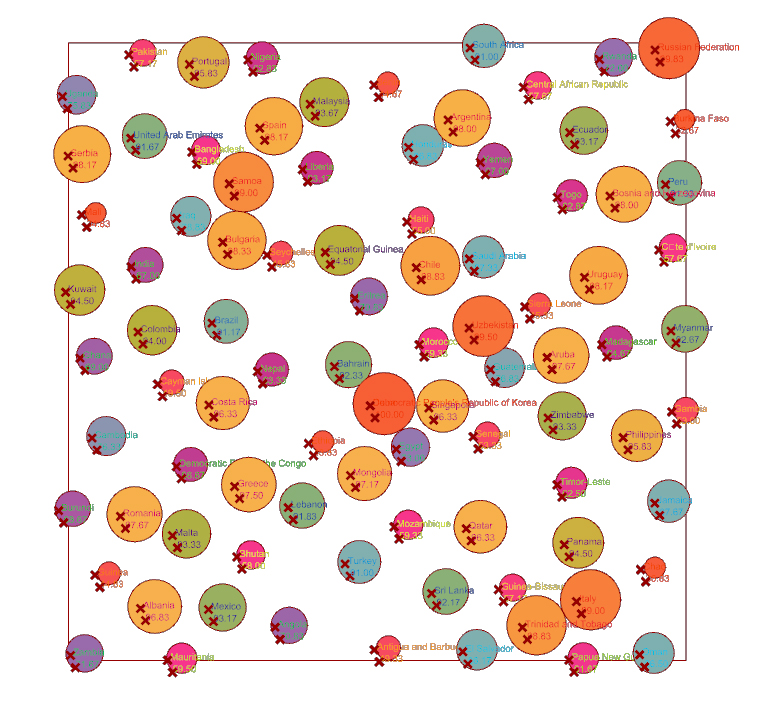
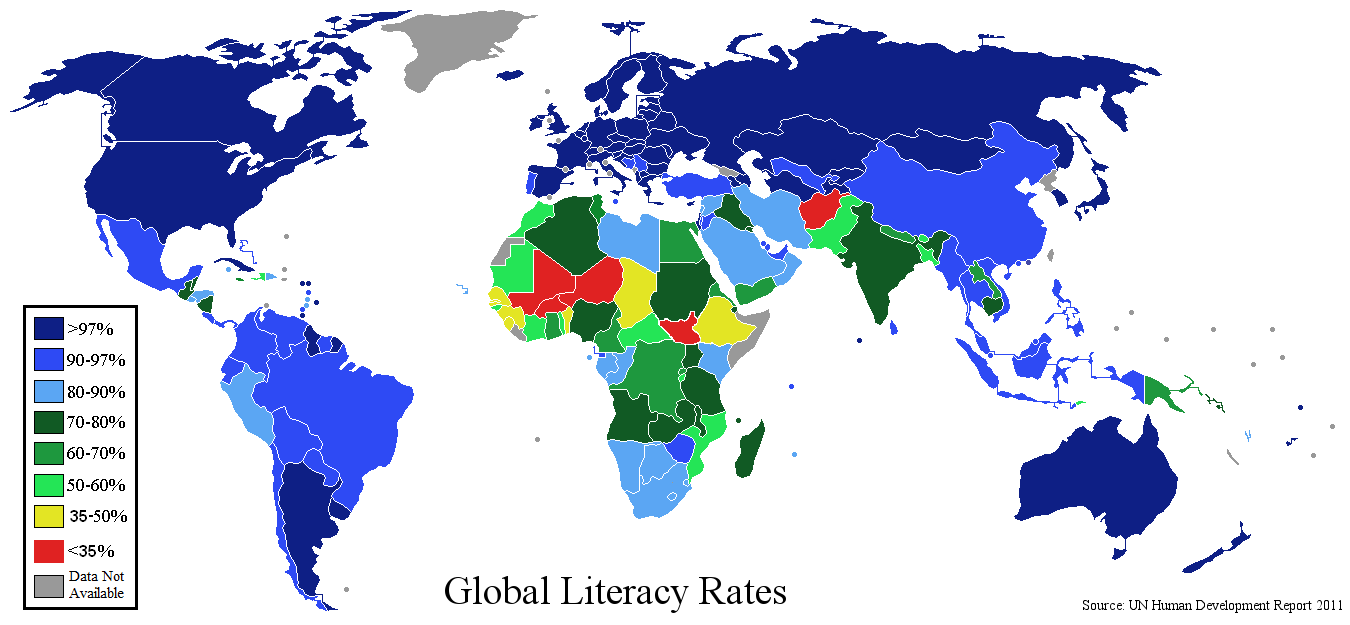
The Statistics are to show the variation in the Literacy rate of all the countries over the world.
The height and radius of the cylinders varies on the variation in the percentage of the literacy.
![]()
Site for data Resources : http://www.unesco.org/new/en/education/themes/leading-the-international-agenda/efareport/statistics/
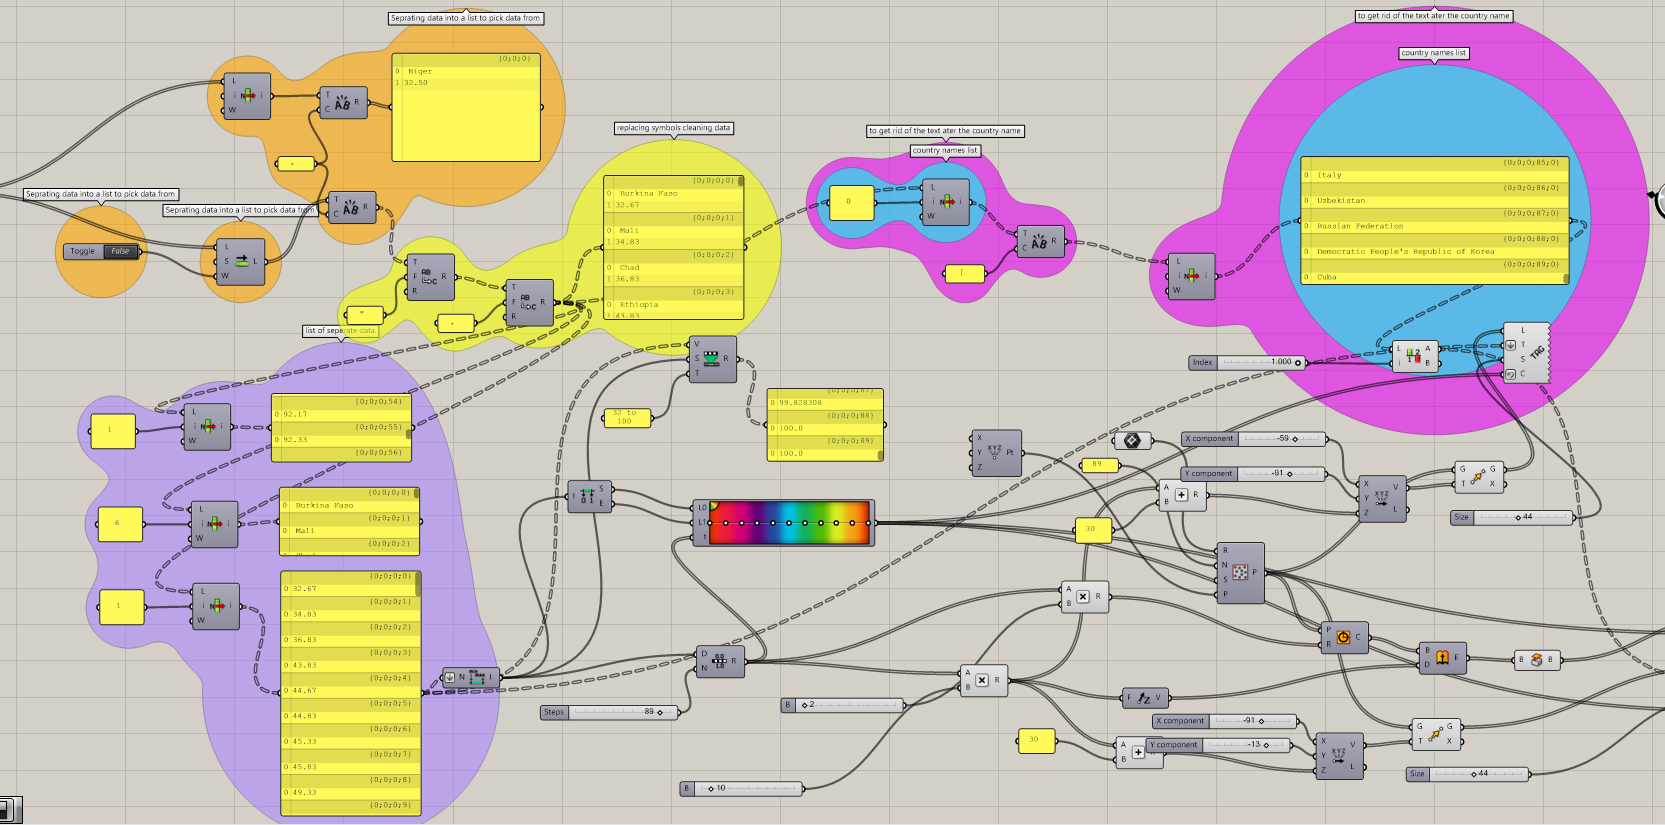
The grasshopper definition for the graphical representation of the data.
The Data covers 90 countries with an average literacy rate from 1995 to 2015 (projected) .