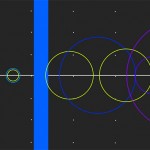
Inspired by data visualization and looking at information as art, this is an experiment to explore the basics of graphically rhythmic visuals using sound as an input and basic geometric shapes to build the visual environment.

Inspired by data visualization and looking at information as art, this is an experiment to explore the basics of graphically rhythmic visuals using sound as an input and basic geometric shapes to build the visual environment.