Happy_planet_index
Data source: http://www.happyplanetindex.org/data/
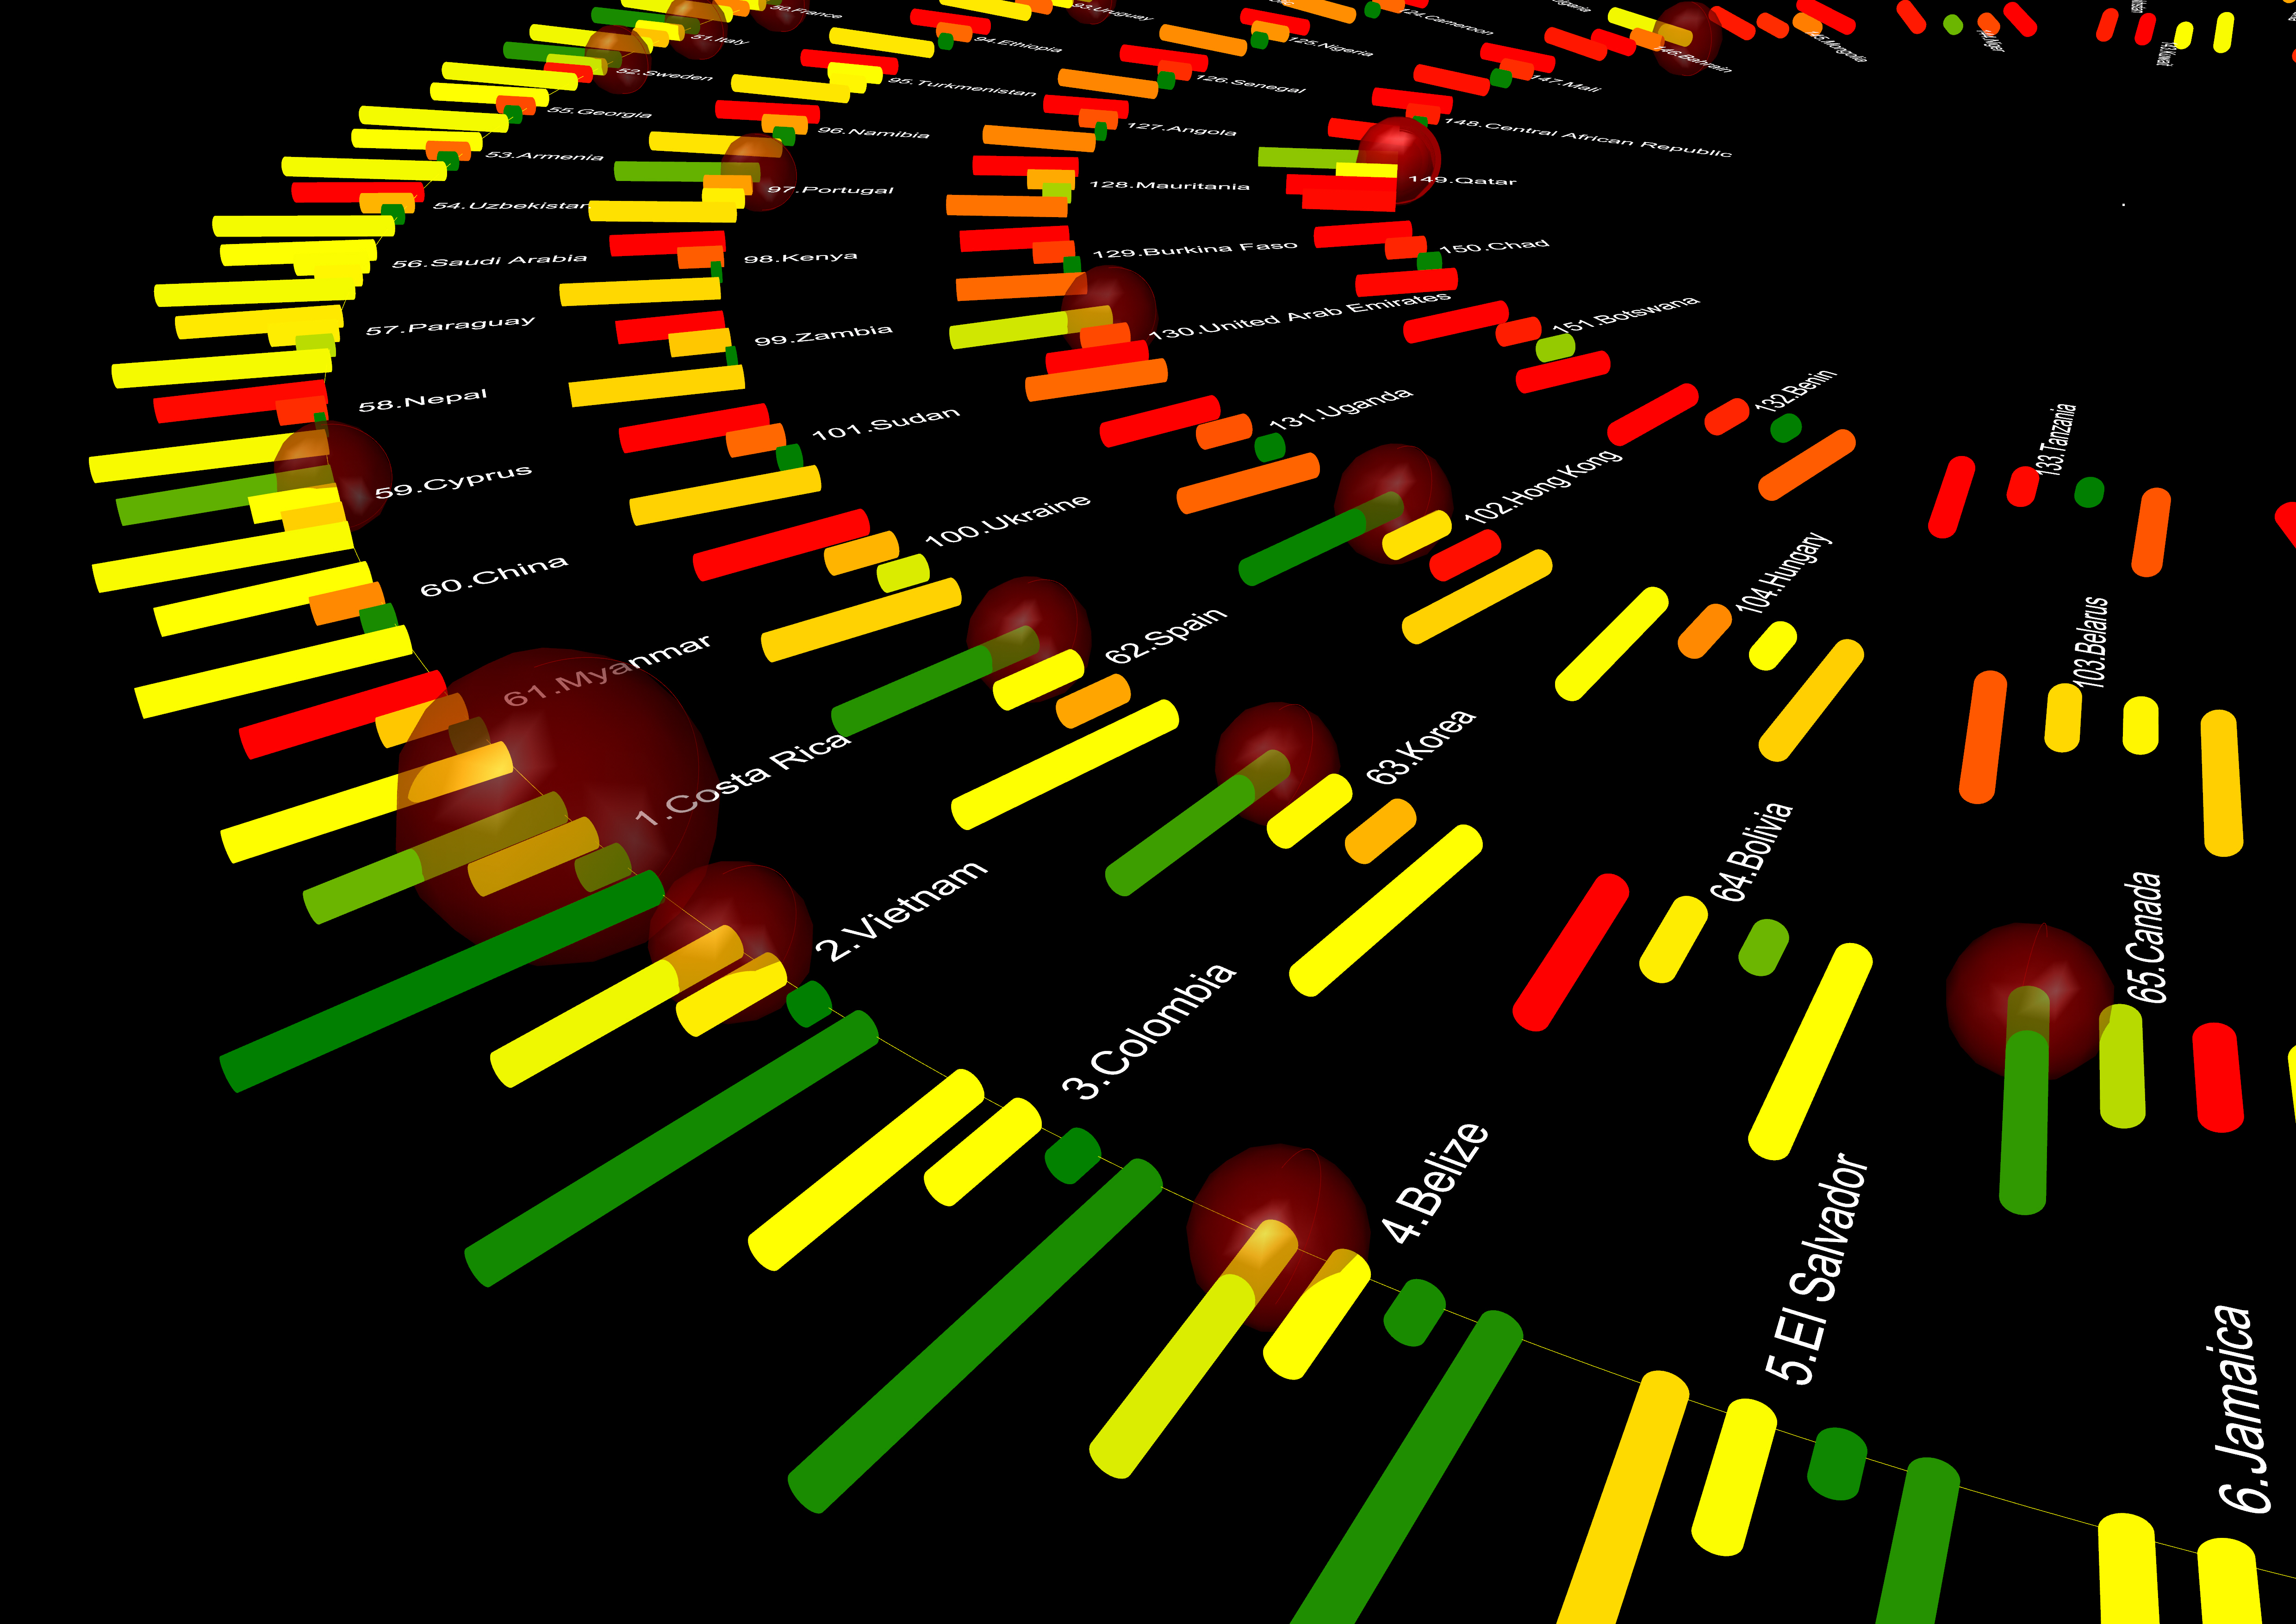
The Happy Planet Index (HPI) introduced by the New Economic Foundation (NEF) ranks 151 countries across the globe on the basis of how many long, happy and sustainable lives they provide for the people that live in them per unit of environmental output. Put another way, it represents the efficiency with which countries convert the Earth’s finite resources into well being experienced by their citizens. Read More
Posted in Irina Shaklova Tagged data visualization, Designing Associativity, grasshopper, happy planet index, iaac, Rhino Comments closed
Frequency Spectrum / Data Visualization
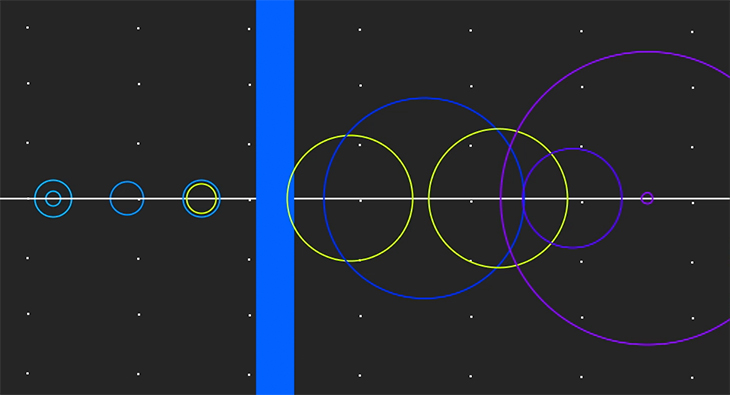
Screenshot from VIDEO
Inspired by data visualization and looking at information as art, this is an experiment to explore the basics of graphically rhythmic visuals using sound as an input and basic geometric shapes to build the visual environment.
Posted in Jhon Alexander Giraldo Mendez Tagged data visualization, frequency spectrum, processing Comments closed
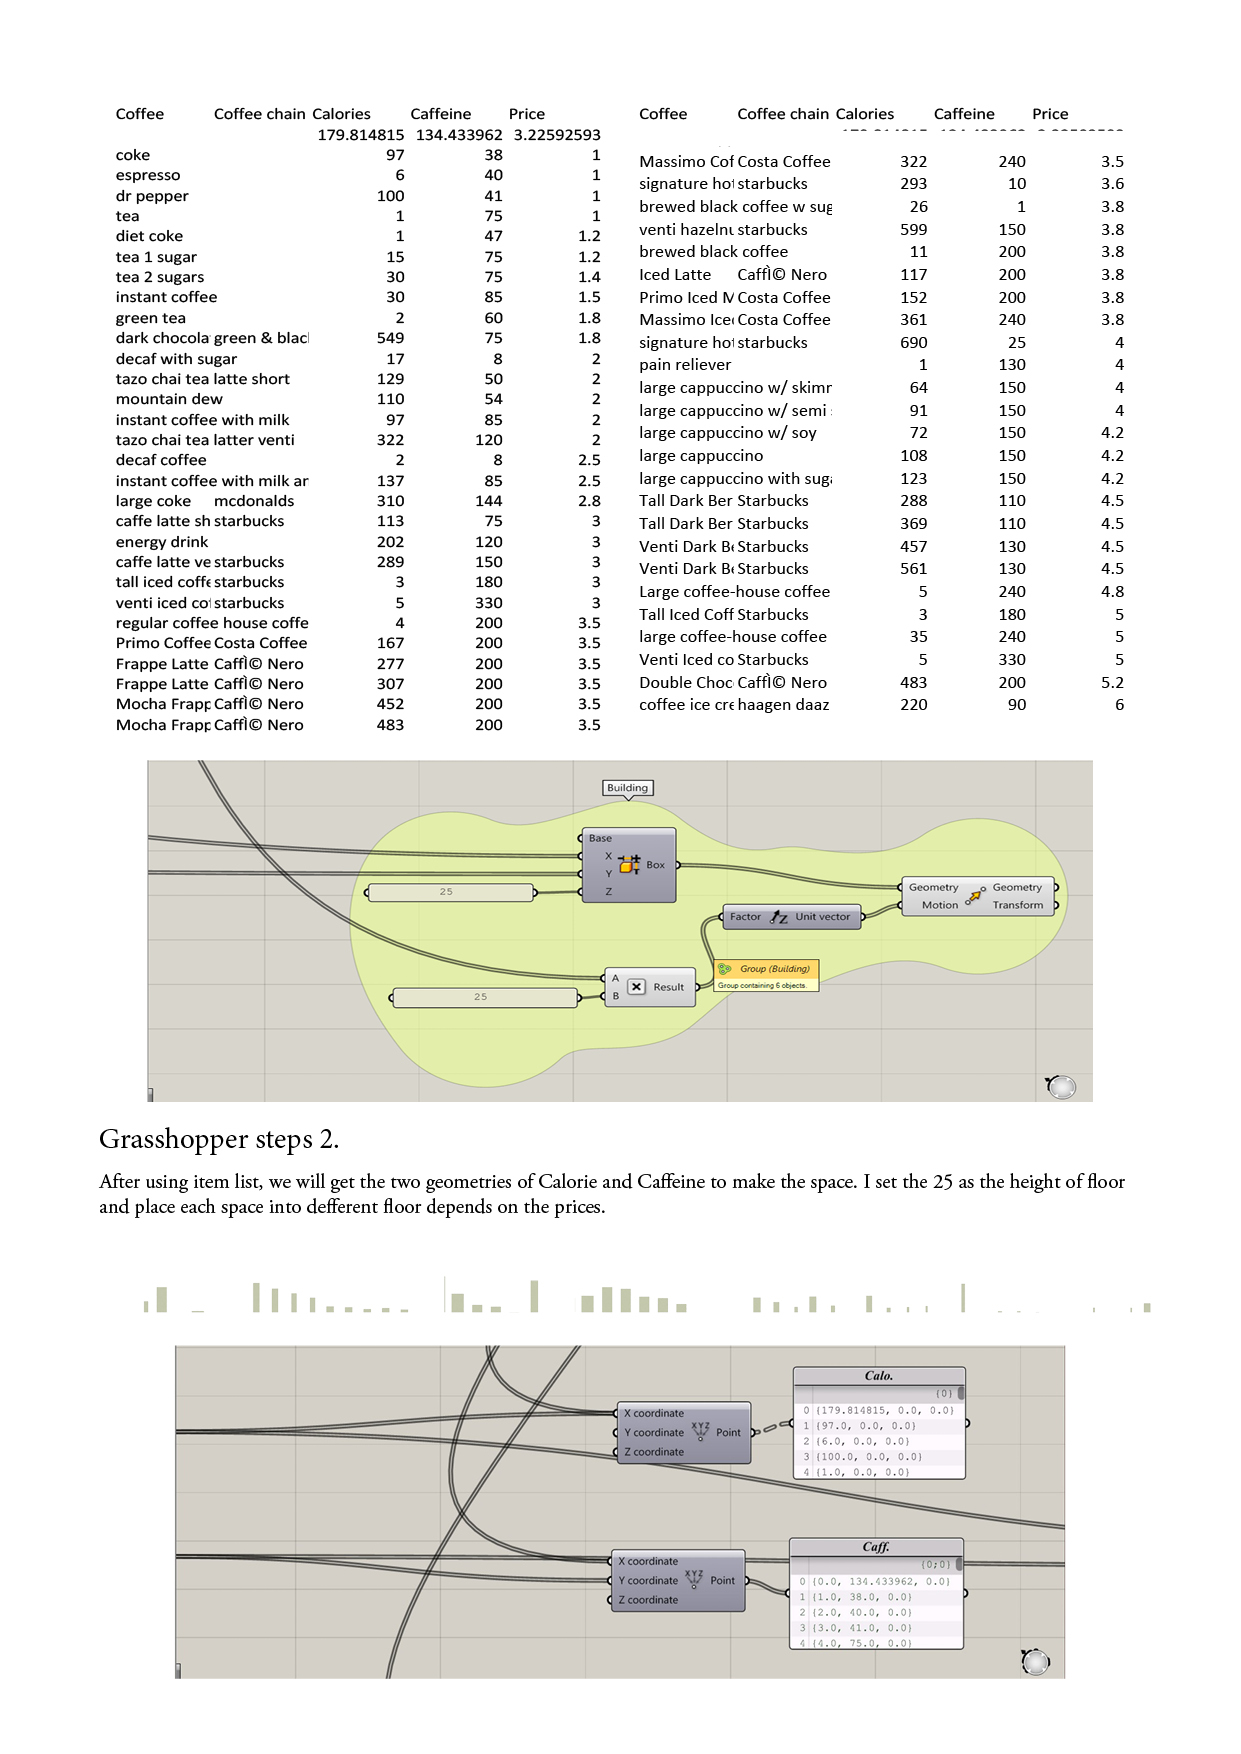
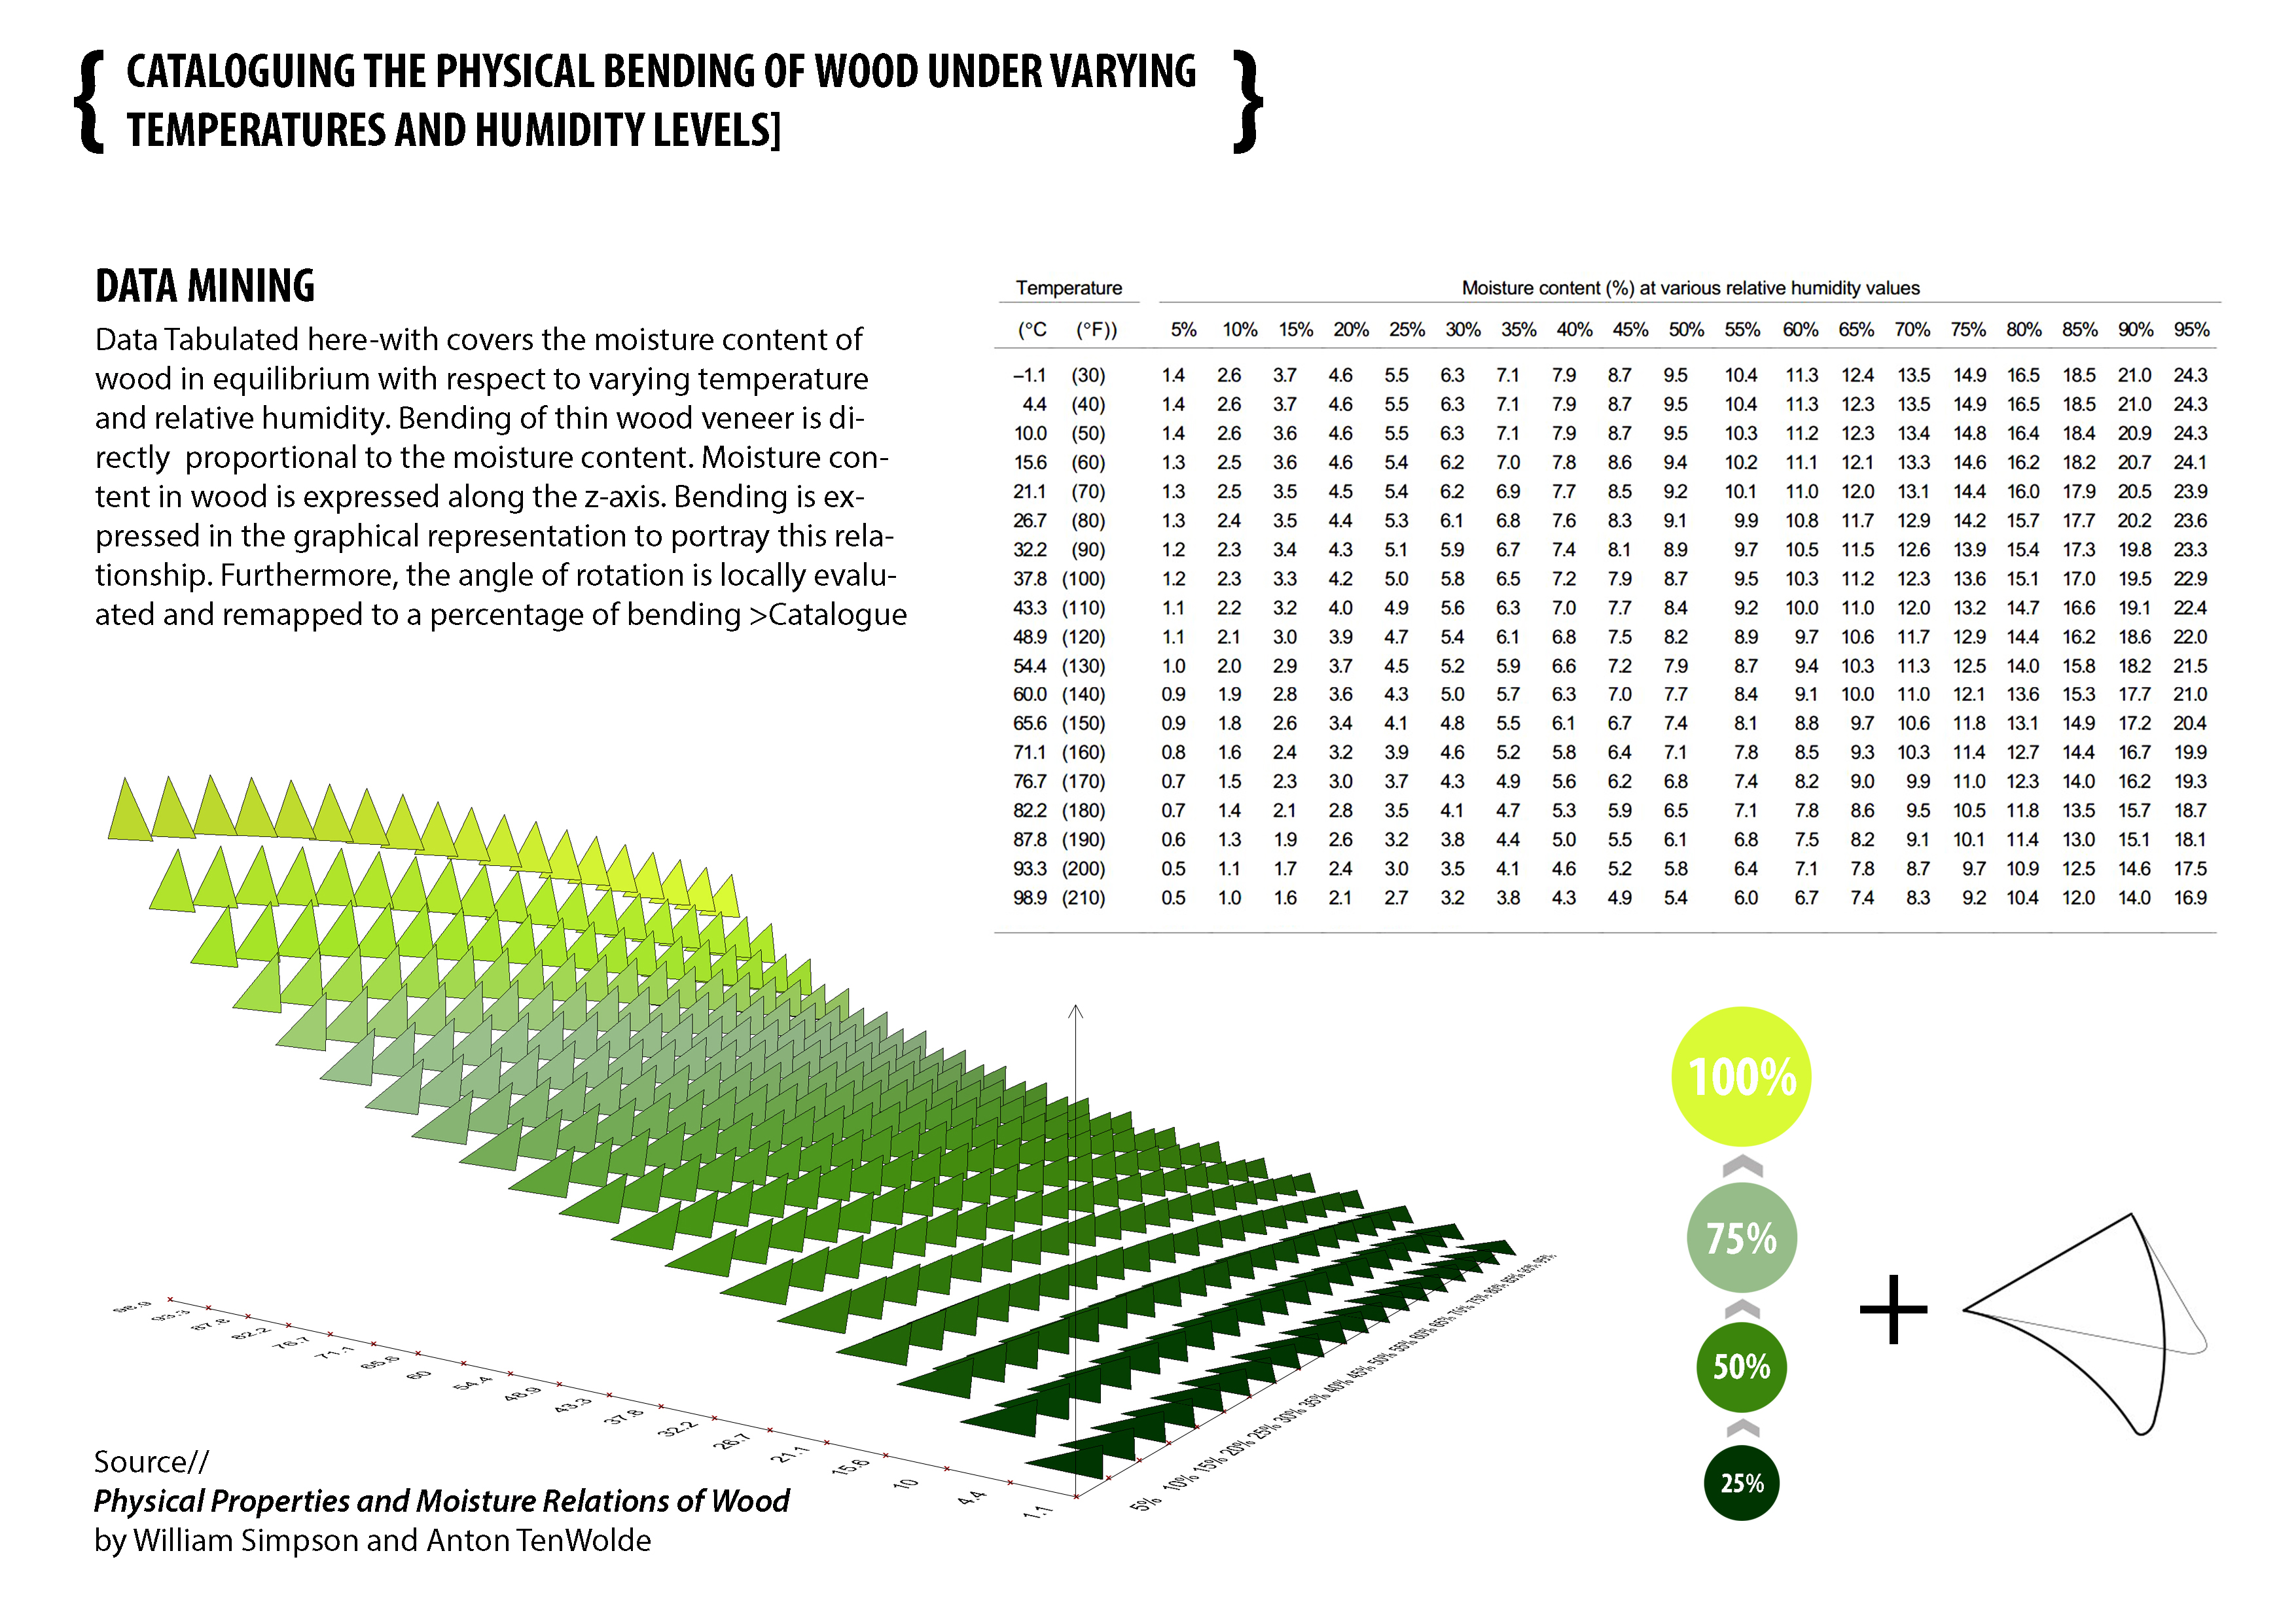
A.1 Visualizing Data [Moisture Content in Wood v/s Temperature and Relative Humidity]

Posted in Stephanie Bashir Comments closed