
plotting wavelengths in nanometres for different types of UV light. blue (minimum) vs gradient (maximum range)
click to enlarge for higher-res


plotting wavelengths in nanometres for different types of UV light. blue (minimum) vs gradient (maximum range)
click to enlarge for higher-res

The residents of Barcelona’s Bon Pastor neighborhood have a long history of displacement, originating from the routes of immigrant relocation from Montjuic and slum dwellers along the River Besos. The area has recently begun a dramatic and long-term transformation in order to gentrify and densify the area as the once-industrial sites surrounding the area are vacated. Intrinsic to this transition is the development of various social programs, river rejuvenation and improved infrastructure.
In analyzing the area as an emergent region for research line 1: Emergent Territories, a survey of the local population data, density, metro station locations and current state serve as a nice compliment. The following is a comparison of various statistics from the metro stations within 3km from the Bon Pastor neighborhood, in the district of Sant Andreu, using data collected from Barcelona and Badalona municipality 2005 census data, Wikipedia, and personal investigative research and data collection.

There are many indicators of happiness for each country.
Weather, food, cultures, festival, religions, health etc. are the first of what I can come up with.
But lifestyle also plays a huge part in happiness, party, drinking and
smoking are undeniably featuring in this equation.
Have a look at the happiest and unhappiest country in Europe
in comparison to alcohol consumption and drugs usage.
Are they the factors of happiness or are they just a fraction of lifestyle
and not necessarily play a big part here.
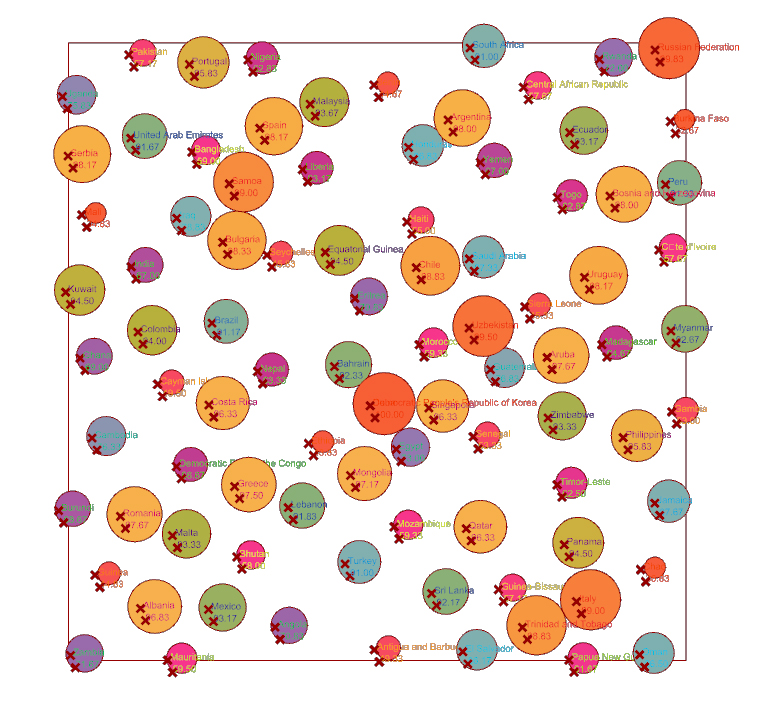
The Statistics are to show the variation in the Literacy rate of all the countries over the world.
The height and radius of the cylinders varies on the variation in the percentage of the literacy.
![]()

Ref :http://cdn.c.photoshelter.com/img-get/I0000bGwBzgosEk4/s/750/750/exit-immigration-spain012.jpg
Immigrants in any place have a positive as well as negative effect on their host country and its economy. Here is a study of number of immigrants per district in Barcelona city.

THE VISUALISATION ABOVE SHOWS THE STUDY OF IMMIGRANT POPULATION IN THE CITY OF
BARCELONA BY DISTRICT

THIS VISUALIZATION HELPS TO UNDERSTAND THE DENSITIES OF IMMIGRANT POPULATION IN
VARIOUS DISTRICTS OF BARCELONA.
Process:
1. SEPARATING A SET OF DATA INTO DIFFERENT LISTS AND CLEANING THEM.
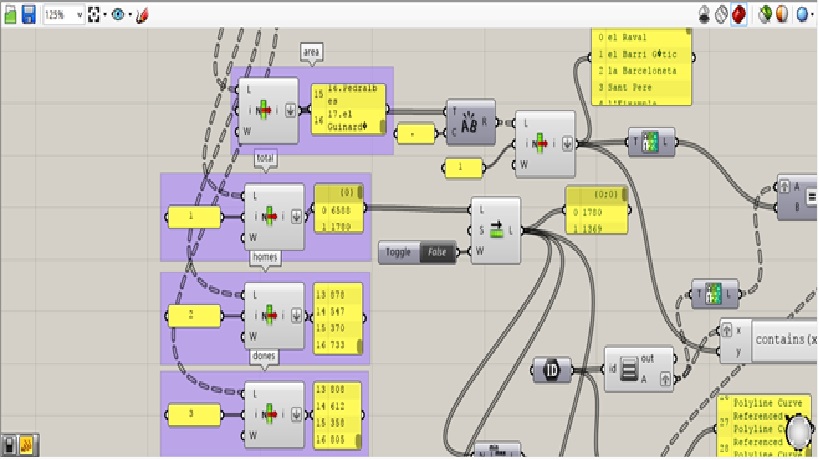
2.CALLING/RETREIVING EACH FIELD DATA AND REMOVING TEXT ENRTY FROM THE DATA TO BE REPRESENTED.

3.SETTING BOUNDS AND REMAPING VALUES TO REPRESENT DATA. SETTING CURVES FOR EXTUSION AND CHECKING FOR A MATCH.