![]()
![]()
![]()
![]()
![]()
![]()
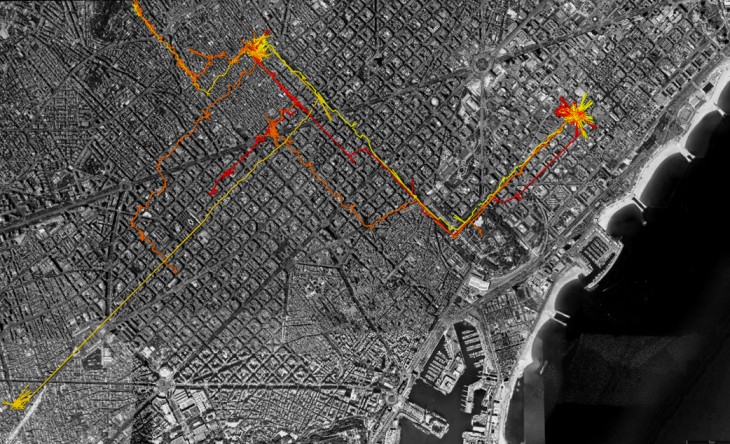
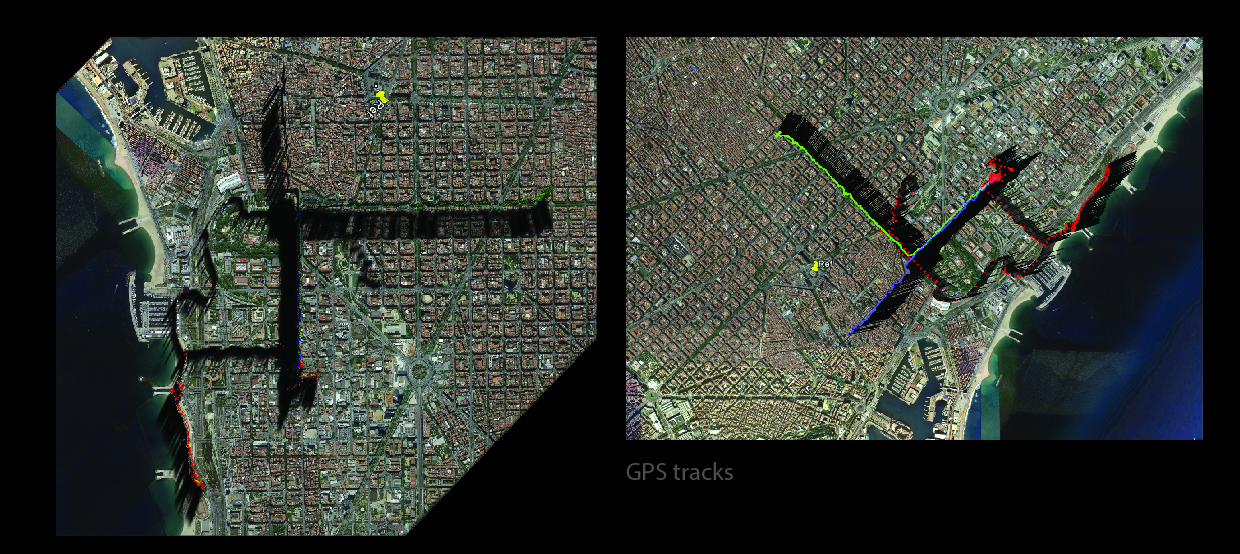
The goal of the GPS mapping here is to show how life of three people is intertwined over common paths, the GPS mapping shows prominent nodes of the city and some important paths common to all. The paths create some enclosed regions making very interesting divisions of the city. The 1st person is denoted by red, 2nd by green and 3rd by red. The concentration of the colors at certain spots is denoting the places where there was more time spent by the individual.
GPS tracking can be a great medium to extract information which can be used to make observations in various fields, it can be very handy to derive stats and data.
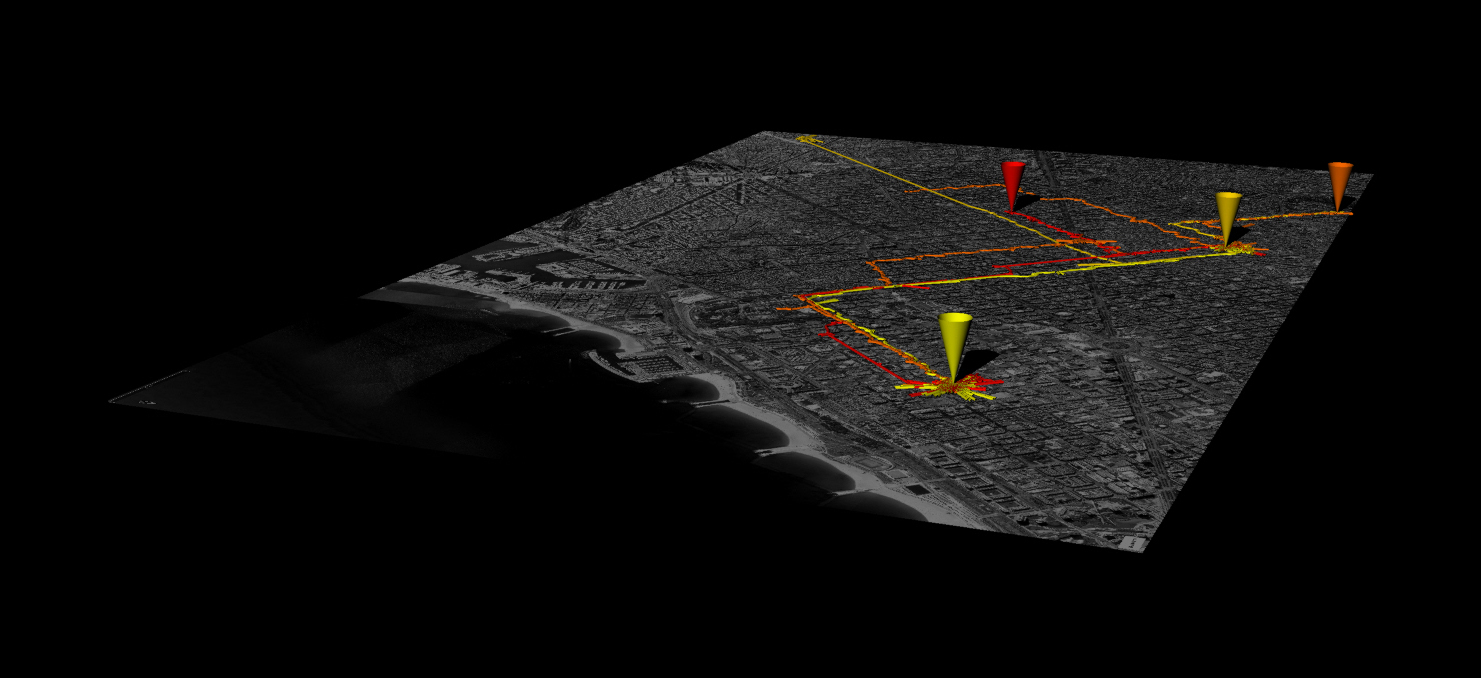
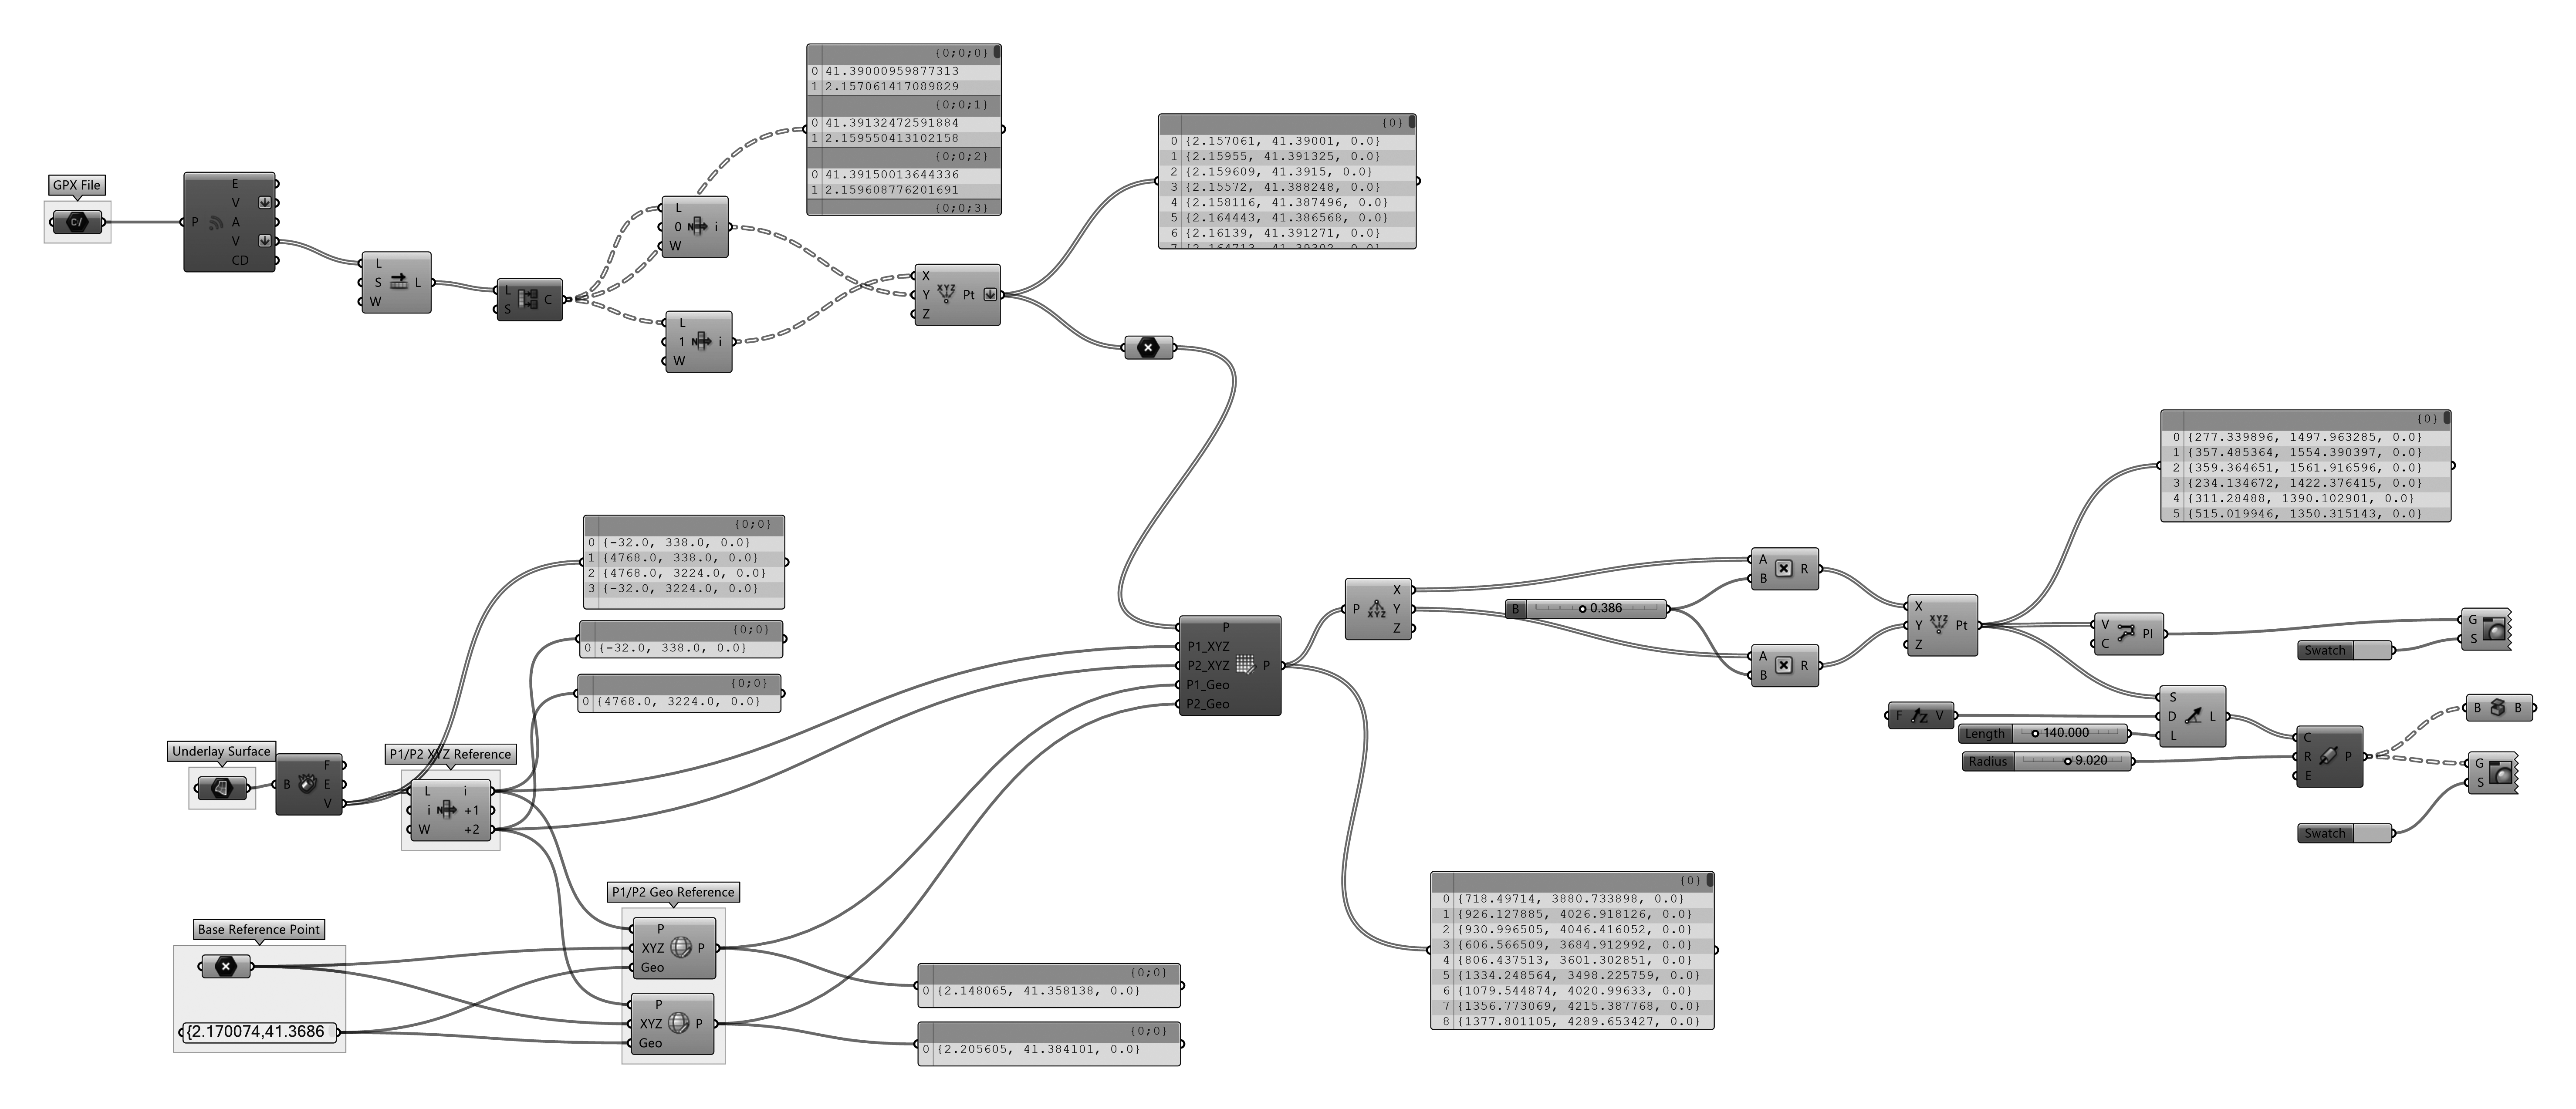
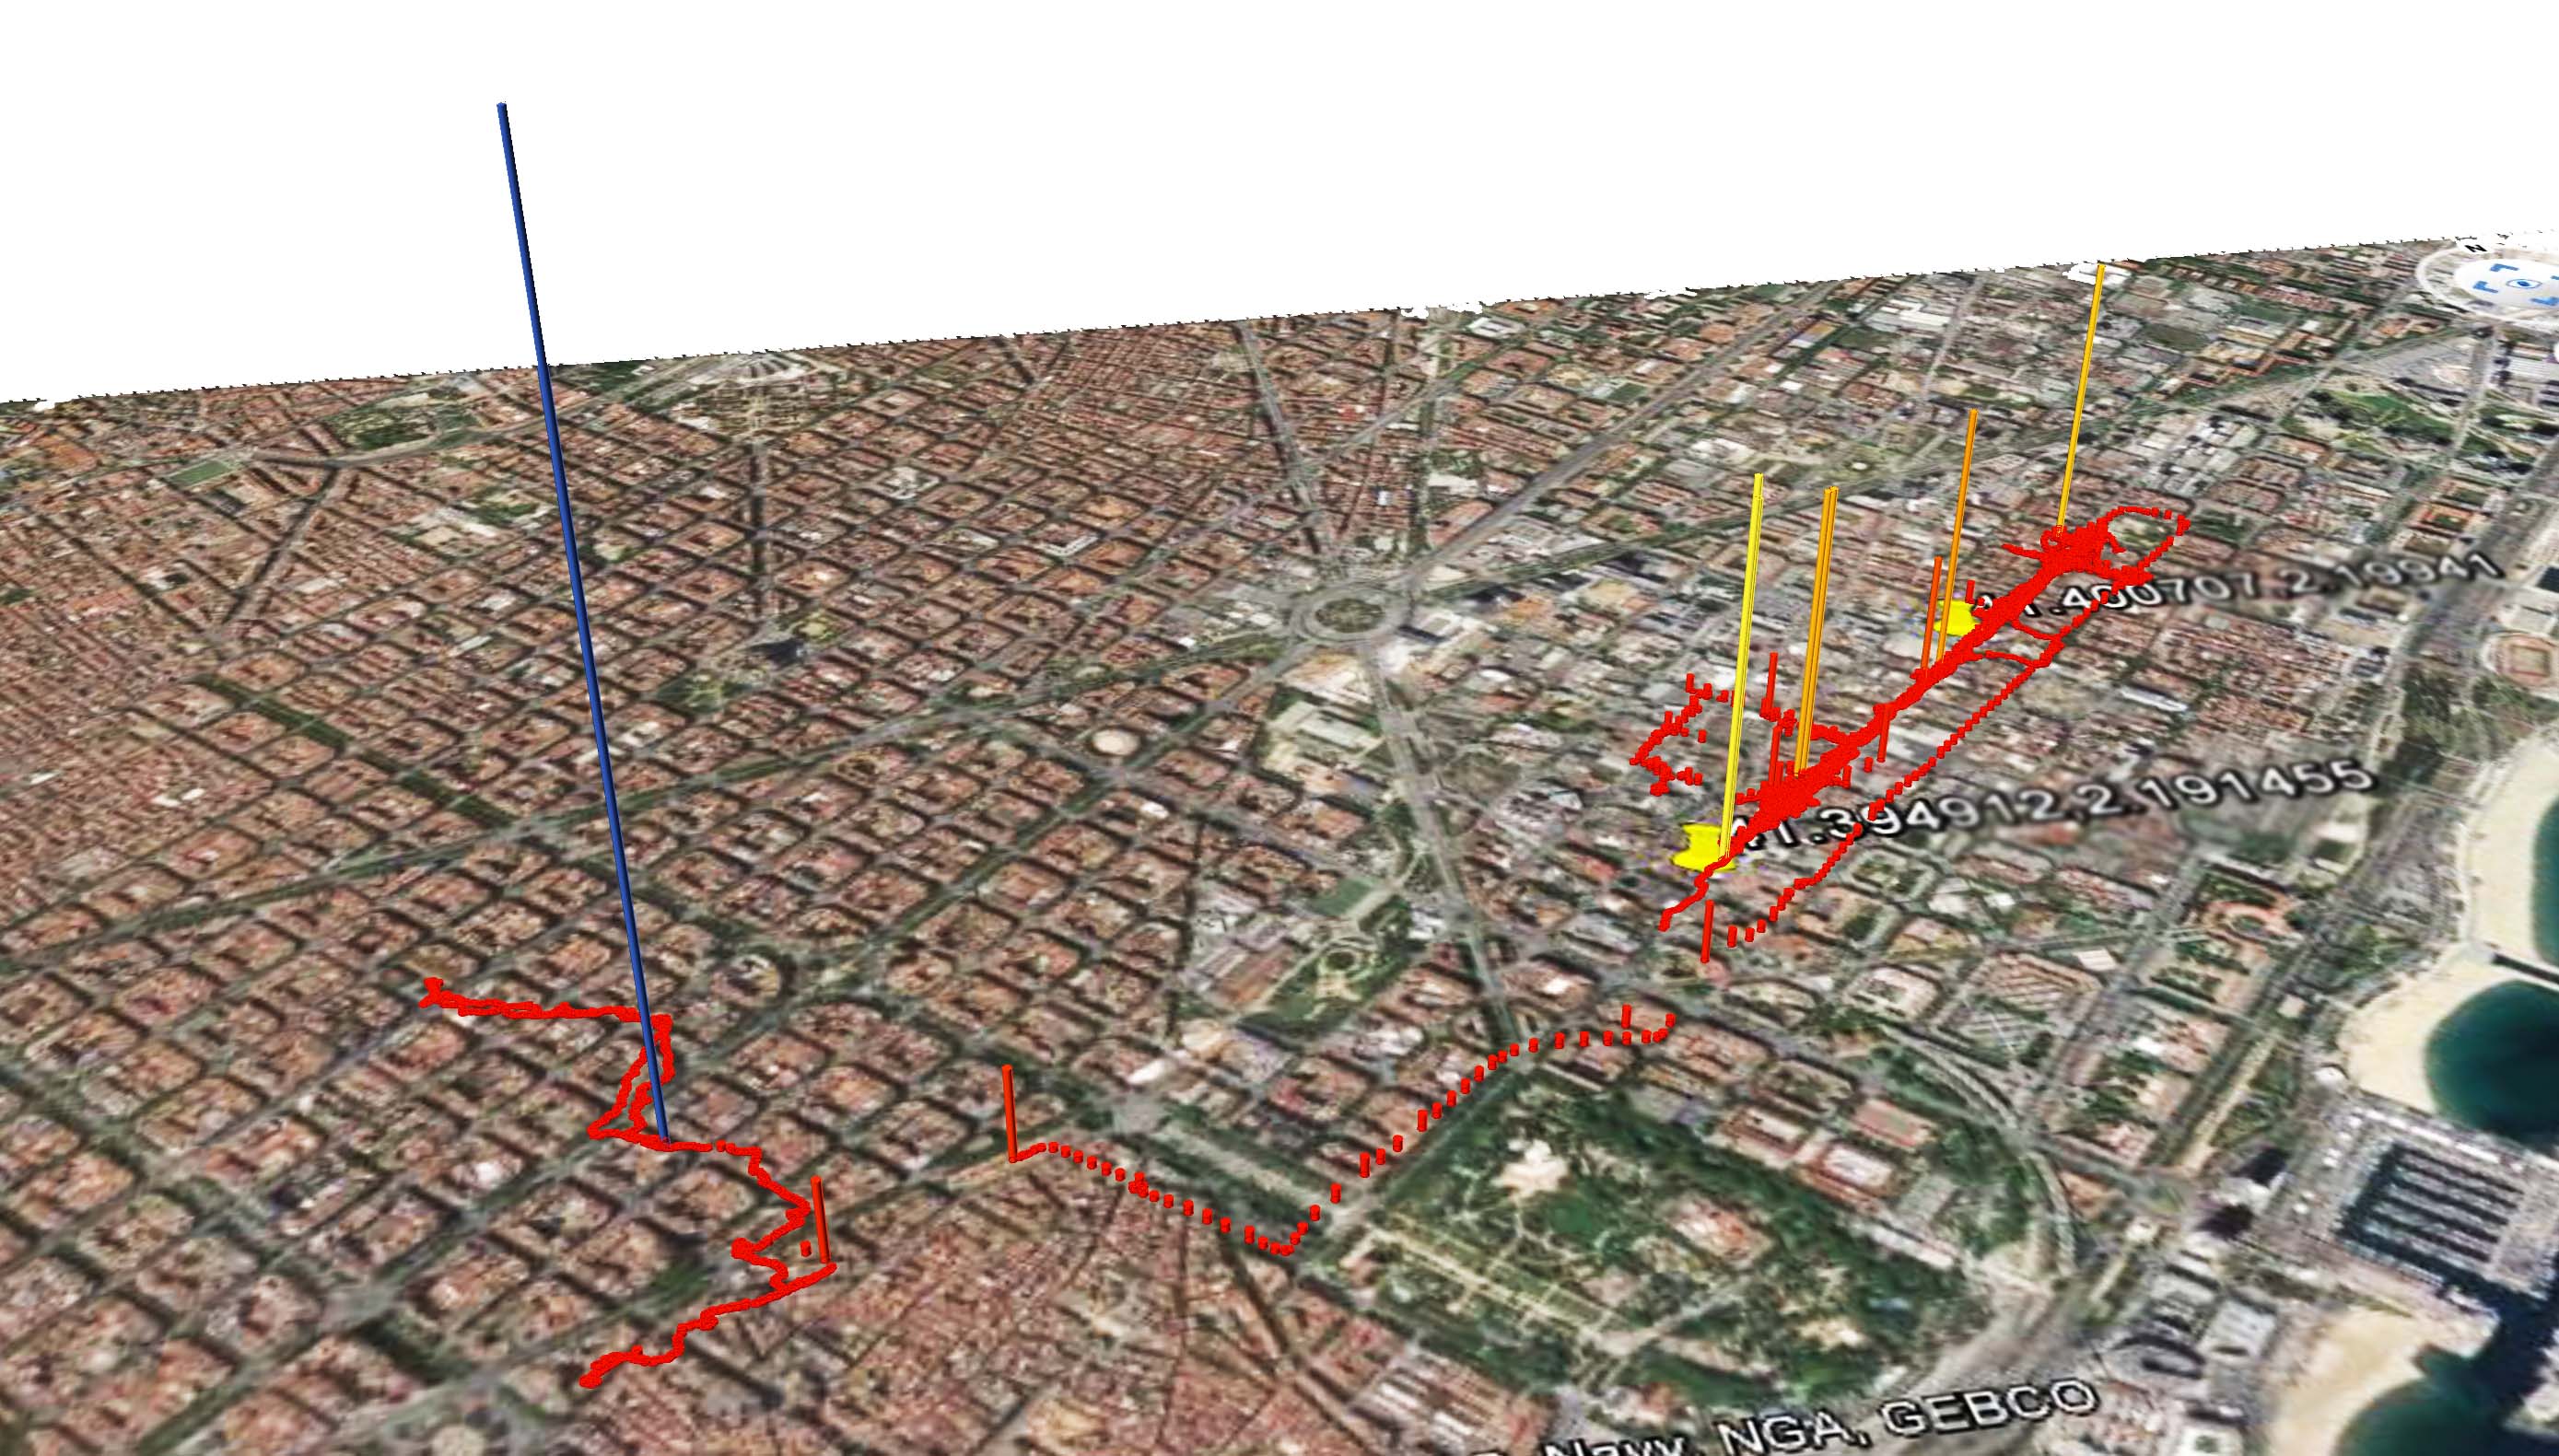
The grasshopper definition has an input of a .gpx file which is then converted to coordinated, these coordinates are then remapped on to an imported goggle map. The representation of each GPS tracked point is in the form of a extruded circles.
mapping 50+ hours of GPS data across Barcelona
0bstacles in grasshopper included the extraction data for different days from one continuous stream of GPS data using an analysis of the times at which the coordinates were being recorded, and the translation of settings from the functions of this data set back to the set of the coordinates themselves. 8141 individual indices recorded in 4 branches
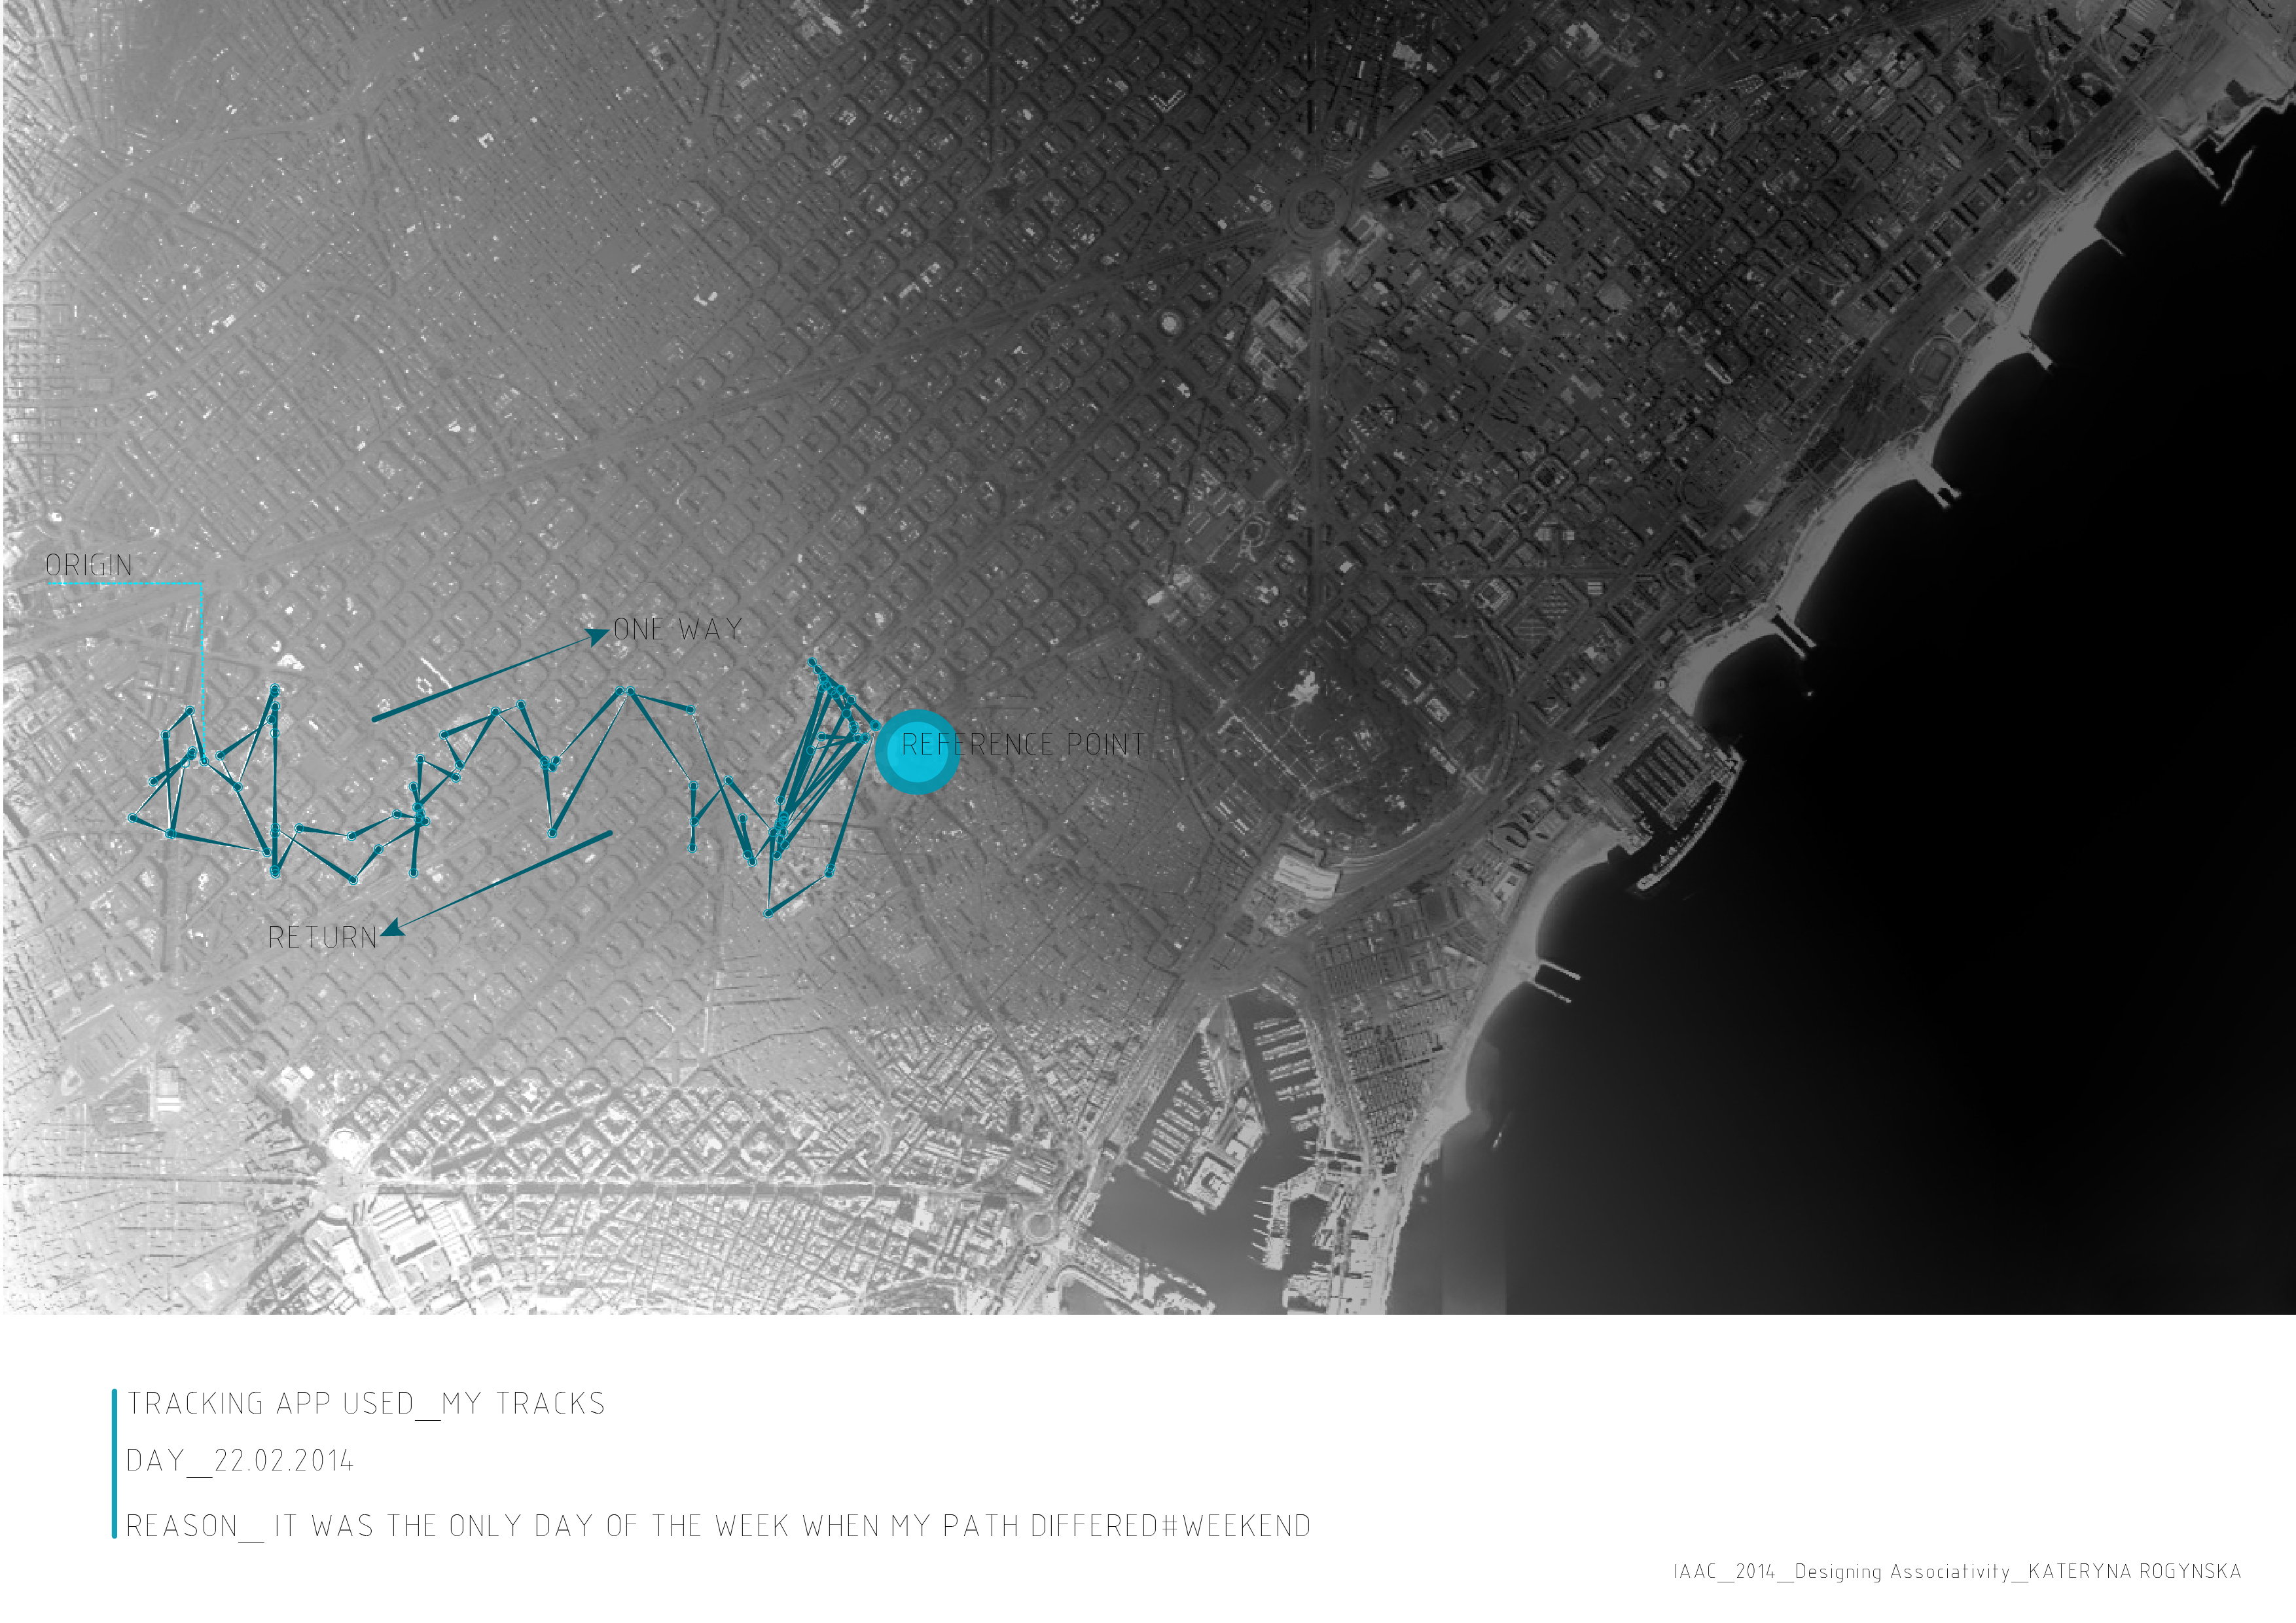
Having tracked myself for several weekdays I realized that the path I am taking every day is virtually identical, thus I decided to visualize data from the only day of past week which followed a different route, a saturday. While the data set that I was able to extract from iPhone app MyTracks was rather scarce( it did not have any altitude information, readings were taken rather sporadically even at 30-second track pace, it did show quite accurately the essence of the route I followed. The route is not repeating itself, as it reflects my movement on a bike around the central part of Barcelona, with the most time spent nearby Placa Catalunya where I also did some off-bike activities.
Through this self-tracking exercised I have learned several things:
\\ it is worth purchasing apps to collect consistent clean data rather than using free software
\\ frequency of data sample collection must be thoroughly correlated with the means of transportation used the most
\\ the absence of Z-coordinate in the data set takes away from understanding ones movement in a city with great topography like Barcelona
Stalking
The track shown reveals the footprint of an average student during a few days of normal school period.