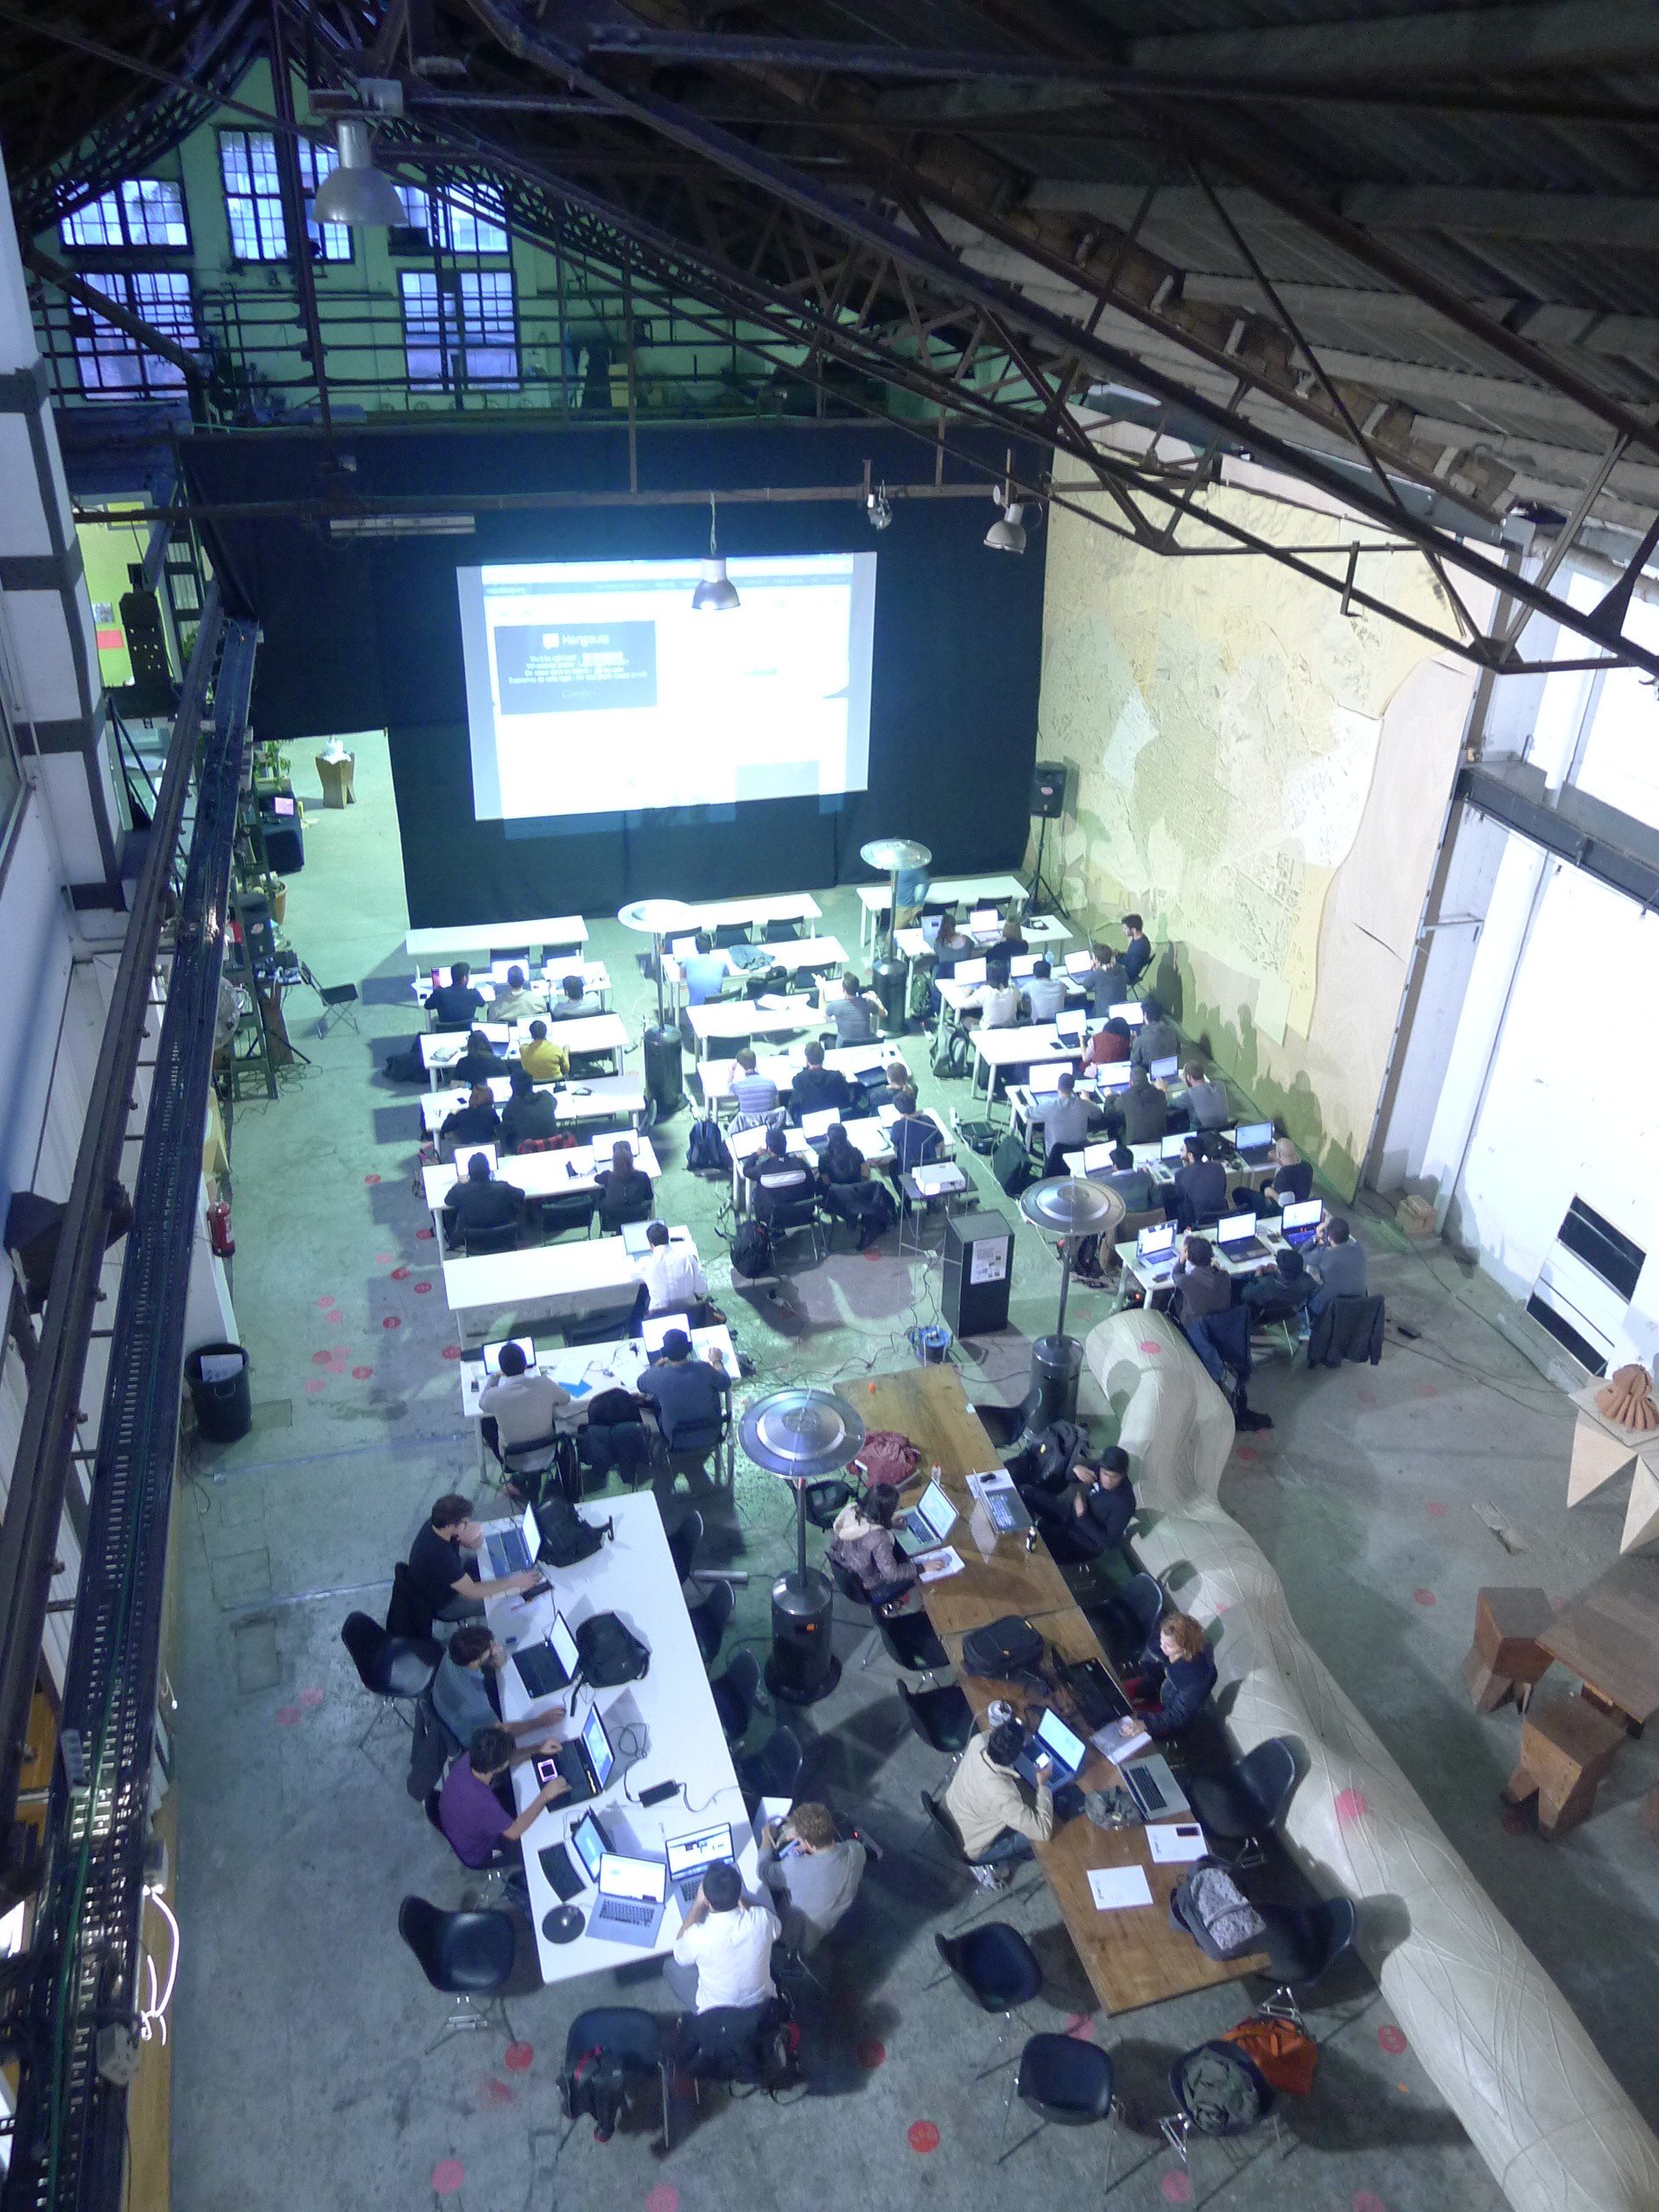
IAAC as academic partner of Visualising.org was this past weekend the Barcelona Hub of 2012 Visualizing Global Marathon. IAAC hosted over 100 participants from ICFO – The Institute of Photonic Sciences; Universitat Pompeu Fabra; Universitat Politècnica de Catalunya; Escola Tècnica Superior d’Enginyers de Camins, Canals i Ports de Barcelona; Universitat Autònoma de Barcelona; Elisava; IED; Bau and IAAC’s students. They were invited to participate in the largest-ever student data visualization competition sponsored by GE and Google. Three days of non stop working!!
The Challenges
The Visualising Global Marathon launched three different challenges:
Challenge 1: Real-Time. “DISEASE ALERTS”
Challenge 2: Big. “GLOBAL FLIGHTS NETWORK”
Challenge 3: Social. US ELECTION IN SOCIAL MEDIA
Visualizing Global Marathon brought together the global student community for an intense, fun, and thought-provoking event with live talks, tutorials, and Q&A sessions. Over 1000 students from 176 universities and 38 countries across the world participated in this event hosted by Visualizing.org
They interacted on the Live Dashboard and delivered insight and solutions on monitoring disease outbreaks, understanding the global flights network, andcontextualizing the 2012 U.S. presidential election. There were Google Hangout broadcasts, a very active #vizmarathon Twitter discussion, awesome photos and more.
IAAC was the only school that was present in the four conferences of the Marathon
Gerta Antanaityte, IAAC’s Master in Advanced Interaction student, won the “best question asked to the experts Award”
The Jury
Amanda Cox, The New York Times
Andrew Vande Moere, Infosthetics
Andy Kirk, Visualising Data
Benjamin Wiederkehr, DataVisualization.ch
Cesar Hidalgo, MIT Media Lab
Greg Petroff, GE
Jake Porway, DataKind
Jen Lowe, Data Telling / OKFN
Jerome Cukier, World Bank
John Keefe, WNYC
Manuel Lima, Visual Complexity
Noah Illinsky, Complex Diagrams
Santiago Ortiz, Moebio
Stefanie Posavec
Tom Uglow, Google
Students, working individually or in teams of up to four members, submitted more than 100 data visualizations to be evaluated by an esteemed jury and from which, we’ll award $15,000 in prizes, courtesy of GE.
The winners will be announced on 5th of December


